Comparison of Greenhouse Gas Offset Quantification Protocols for Nitrogen Management in Dryland Wheat Cropping Systems of the Pacific Northwest
 Tabitha T. Brown
 Carrie M. Lee2
  Chad E. Kruger
 John P. Reganold
 David R. Huggins
- 1Department of Crop and Soil Sciences, Washington State University, Pullman, WA, United States
- 2U.S. Center, Stockholm Environment Institute, Seattle, WA, United States
- 3WSU Mount Vernon Northwest Washington Research & Extension Center, Mt. Vernon, WA, United States
- 4Center for Sustaining Agriculture and Natural Resources, Washington State University, Puyallup, WA, United States
- 5Northwest Sustainable Agroecosystems Research, United States Department of Agriculture-Agricultural Research Service, Pullman, WA, United States
In the carbon market, greenhouse gas (GHG) offset protocols need to ensure that emission reductions are of high quality, quantifiable, and real. Lack of consistency across protocols for quantifying emission reductions compromise the credibility of offsets generated. Thus, protocol quantification methodologies need to be periodically reviewed to ensure emission offsets are credited accurately and updated to support practical climate policy solutions. Current GHG emission offset credits generated by agricultural nitrogen (N) management activities are based on reducing the annual N fertilizer application rate for a given crop without reducing yield. We performed a “road test” of agricultural N management protocols to evaluate differences among protocol components and quantify nitrous oxide (N2O) emission reductions under sample projects relevant to N management in dryland, wheat-based cropping systems of the inland Pacific Northwest (iPNW). We evaluated five agricultural N management offset protocols applicable to North America: two methodologies of American Carbon Registry (ACR1 and ACR2), Verified Carbon Standard (VCS), Climate Action Reserve (CAR), and Alberta Offset Credit System (Alberta). We found that only two protocols, ACR2 and VCS, were suitable for this study, in which four sample projects were developed representing feasible N fertilizer rate reduction activities. The ACR2 and VCS protocols had identical baseline and project emission quantification methodologies resulting in identical emission reduction values. Reducing N fertilizer application rate by switching to variable rate N (sample projects 1–3) or split N application (sample project 4) management resulted in a N2O emission reduction ranging from 0.07 to 0.16, and 0.26 Mg CO2e ha−1, respectively. Across the range of C prices considered ($5, $10, and $50 per metric ton of CO2 equivalent), we concluded that the N2O emission offset payment alone ($0.35–$13.0 ha−1) was unlikely to encourage a change in fertilizer N management; however, the fertilizer cost savings from adopting variable or split N management would incentivize adopting these practices. Therefore, the monetary incentive of adopting agricultural N management BMPs for reducing N2O emission should be tied to other co-benefits and existing conservation programs to encourage N rate reductions that do not limit yield, crop quality, or economic stability.
Introduction
There is growing concern over rising atmospheric concentrations of nitrous oxide (N2O), a greenhouse gas (GHG) 310 times more potent than carbon dioxide (CO2) (Robertson and Vitousek, 2009; United States Environmental Protection Agency, 2013). GHG concerns are coupled with negative environmental consequences associated with accelerated rates of reactive N entering and cycling through ecosystems (Vitousek et al., 1997; Robertson and Vitousek, 2009). The agricultural sector is the largest contributor to rising N2O emissions in the US with 69% of N2O emissions from agricultural soil management (United States Environmental Protection Agency, 2013) (Figure 1). Increased N2O emissions from agricultural soil management result from application of synthetic N fertilizer, manure additions, and drainage and cultivation of organic soils (United States Environmental Protection Agency, 2013). Therefore, reducing N rate has been targeted as an opportunity to reduce GHG emissions and achieve other co-benefits, such as reducing N in runoff. However, under GHG offset programs, N fertilizer rate reductions must not result in substantial yield reductions (American Carbon Registry, 2010, 2012; Climate Action Reserve, 2012; Verified Carbon Standard, 2013) as an increasing world population will demand greater agricultural productivity from cropping systems that are currently reliant on synthetic N fertilizers to achieve high yields. This has placed considerable pressure on agriculture to reduce hydrologic or gaseous losses of N without compromising yield which supports increased N use efficiency that may or may not result in N rate reductions (Robertson and Vitousek, 2009).
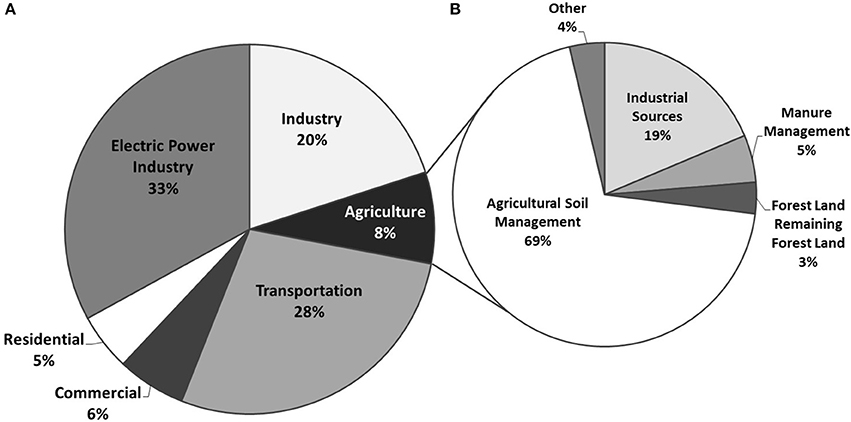
Figure 1. Emission estimates from EPA Inventory of U.S. Greenhouse Gas Emissions and Sinks from 1990 to 2011 by: (A) major U.S. economic sector; and (B) N2O emission sources (United States Environmental Protection Agency, 2013).
One policy tool to incentivize N fertilizer rate reductions is carbon offsets. Carbon offsets, also known as GHG offsets, are emission reductions achieved at sources outside of a capped sector that result in offset credits. Offset programs provide a mechanism where covered entities can offset their emissions by purchasing emission reduction credits. Offset protocol methodologies have been developed to ensure that GHG emission reductions are actually achieved (i.e., real and verifiable) and beyond what would have occurred without the incentive of the offset program payment (i.e., additional to business as usual) (Broekhoff and Zyla, 2008). The protocol methodology for quantifying emission reductions are the standard for accurate accounting of emission reductions and offset credits generated by project activities. Offset quantification protocols are therefore critical for establishing credibility in emission reductions and offset markets (Kollmuss et al., 2010; Lazarus et al., 2010).
Fertilizer N rate reductions have been targeted in offset programs because the addition of N increases the amount of available soil N for processes that produce N2O emissions from agricultural soils (mainly nitrification and denitrification) (Smith et al., 2008) and are relatively easy to monitor and verify (Intergovernmental Panel on Climate Change, 2006). Furthermore, fertilizer N rate can be used as an integrator of several management practices that can be adopted alone or simultaneously to reduce N2O emissions. This might include adopting crop rotations with an N capturing component, improving prediction of N requirement, and employing the principles of precision N management of right place, right time, right source, and right rate (Smith et al., 2008; Robertson and Vitousek, 2009). Offset protocols for agricultural N management encourage practices that better predict crop N demand and increase N-use efficiency (Robertson and Vitousek, 2009; Millar et al., 2012) and can allow for reduced N fertilization rates while also meeting crop N demand. Precision N management practices that reduce N fertilizer application rates without reducing crop yield therefore offer one potential management strategy to reduce agricultural N2O emissions, generate GHG offsets, and decrease the amount of reactive N entering the environment.
Currently, N fertilizer rate recommendations for wheat are based on an expected yield goal and the unit N requirement (UNR). The UNR is the amount of nitrogen needed to produce one unit of grain (e.g., a bushel or kilogram). In the iPNW, where wheat is the dominant and most profitable crop for farmers, the UNR is generally determined by wheat class across a given region and reported in regional fertilizer guides (e.g., Koenig, 2005; Mahler and Guy, 2007). Yield goal and UNR are often assumed to be uniform across a given field and are used to calculate a uniform N application rate for a given field. However, variability in wheat yield and N requirement has been observed across agricultural fields within the Palouse region of the iPNW (Mulla et al., 1992; Fiez et al., 1994a,b; Huggins, 2010). For example, Fiez et al. (1994a) reported soft white winter wheat grain yield to vary by up to 63% and the UNR to vary by up to 70% in the Palouse. Sowers et al. (1994) observed split N applications in winter wheat to produce similar grain yield with 25–40% less N. This indicates that variable rate and/or split N fertilizer application have the potential to reduce overall N rate without decreasing yield.
Our focus was to improve understanding of methodologies for quantifying GHG offset credits generated under current offset programs with agricultural N management protocols. Quantification of offset credits was applied to sample projects developed from a literature review of precision N management for dryland wheat cropping systems of the iPNW. Offset quantification under sample project scenarios was used to evaluate the relevance of existing offset programs and quantification protocol methodologies for iPNW agroecosystems. A road test of agricultural N management protocols was performed following the approach of Lee et al. (2013) and Lazarus et al. (2010) to provide a framework for comparing N-based GHG offset programs for iPNW dryland wheat agriculture. The objectives of this project were to (i) review and assess the current components of agricultural N management protocols for relevance to the iPNW; (ii) road-test quantification approaches for N2O emission reductions under applicable protocols using sample projects; (iii) investigate the impact of quantification approaches on the magnitude of offsets generated; and (iv) assess the role of agricultural N management offset credits as incentive for changing N management strategies for PNW wheat-based cropping systems.
Methods
Offset Quantification Methodologies for iPNW Agricultural N Management
Eligibility Requirements
We identified four voluntary GHG reduction programs applicable to North America with agricultural N management protocols: the American Carbon Registry (ACR), Verified Carbon Standard (VCS), Climate Action Reserve (CAR), and Alberta Offset Credit System (Alberta) (Table 1). The ACR and VCS offset programs have international applicability. The CAR program is applicable to project locations within the US and the Alberta program is applicable in the Canadian province of Alberta. All programs are associated with an offset registry system where verified emission reductions from approved project activities are transparently serialized and tracked. Within the four GHG reduction programs, five agricultural N management protocols with approved methodologies for quantifying N2O emission reductions from adoption of approved N management practice were identified (Table 1).
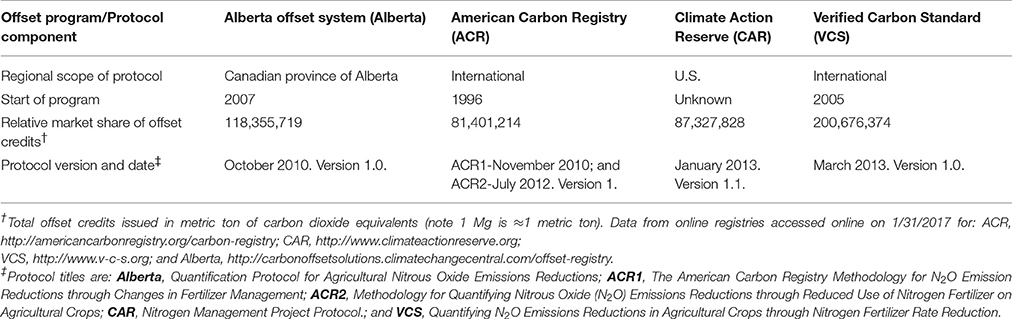
Table 1. Greenhouse gas offset programs and agricultural nitrogen management protocols for North America.
Programs and protocols whose eligible project locations included the iPNW (i.e., Washington, Idaho, Oregon) were considered currently applicable to iPNW wheat-based cropping systems. Based on the regional scope of each program, only three of the five quantification protocols for agricultural N2O emission offsets could be used to quantify voluntary offsets for the iPNW (Table 1). Projects are accepted on land worldwide under the ACR1 (American Carbon Registry, 2010) and ACR2 (American Carbon Registry, 2012) protocols. The VCS protocol is applicable for offset projects occurring within the US (Verified Carbon Standard, 2013). Sites throughout the US were eligible under the CAR program but the only agricultural N management protocol currently approved by CAR was specific to corn crops grown in the North Central Region of the US (Climate Action Reserve, 2012). Therefore, the ACR and VCS protocols are currently the only three protocols applicable to the iPNW based on eligible project location. Though not applicable to the iPNW, the Alberta and CAR protocols were reviewed as their general features and quantification approaches could inform the future development of an agricultural N management GHG offset protocol for iPNW wheat-based agricultural systems.
In addition to eligible project locations, quantification protocols also include general eligibility conditions such as project start date, eligible crops, additionality, and regulatory surplus requirements that once satisfied did not appear to factor into the quantification of offsets generated (Table 2). The project start date indicated the earliest date that project activities could be credited for offsets generated. All fertilized agricultural crops requiring external N inputs to achieve high production of food, fiber, or fodder were accepted under the protocols except for CAR in which only corn crops can be credited. Regulatory surplus is an additionality test, generally requiring project activities to be in addition to the requirement of current laws and regulations.
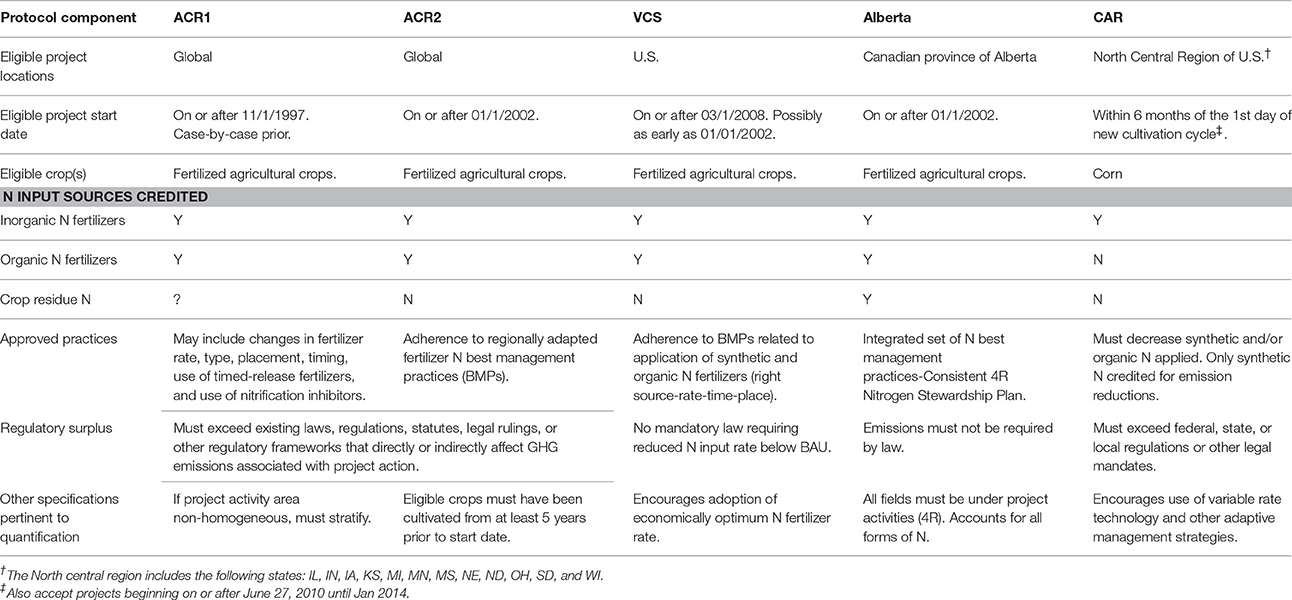
Table 2. Eligible conditions and practices for agricultural nitrogen management offset protocols.
Eligible N Sources and Management Activities
Sources of N inputs into a cropping system during any given crop year might include manure, synthetic N fertilizer, crop residue N, soil organic matter N mineralization, and biological N fixation (Table 2). The ACR1 protocol accepts a broad range of fertilizer management activities to reduce N rate (i.e., change in fertilizer rate, type, placement, timing, use of time-release fertilizers, and use of nitrification inhibitors). The ACR2 and VCS protocols require adherence to regionally adapted N fertilizer best management practices (BMPs), which include N fertilizer source, timing of N application, and method of N fertilizer application. Under ACR2 and VCS, project developers are referred to state specific resources for detailed N fertilizer BMPs (e.g., USDA-NRCS). The Alberta quantification protocol, distinct from the other protocols, requires project participants to adopt an increased level of N management within the “Consistent 4R Nitrogen Stewardship Plan,” which is an integrated set of management practices (Alberta Environment, 2010). The CAR protocol does not specify eligible practices but requires that project N application rates must decrease below baseline.
Baseline and Project Emission Calculation
Greenhouse gas (GHG) emissions are expressed as carbon dioxide equivalents (CO2e) and reported in megagram (metric ton) increments (Mg CO2e). Carbon dioxide equivalents are a global warming potential weighting that is based on radiative forcing over a 100-year time scale and resulting from the release of 1 kg of a substance as compared to 1 kg of CO2 (Intergovernmental Panel on Climate Change, 2006). Under all of the protocols reviewed, a global warming potential of 310 was used for N2O-N emission conversions to CO2e. Baseline N2O emissions represent the emissions that would have occurred absent the offset market incentive. Project N2O emissions represent the emissions that occur under the project scenario. The general equation for calculating N2O emission reduction from project activities was based on the difference between the baseline and project emissions as follows:
Where ERMtCO2e yr−1 are emissions reductions from the project; BMtCO2e yr−1 are baseline emissions; and PMtCO2e yr−1 are project emissions.
Sources and Sinks Included in Emission Quantification
The assessment boundary specifies the GHG sources and sinks to be included in the quantification of baseline and project emissions. The assessment boundary does not necessarily represent a physical boundary, but instead represent the quantification boundary for including/excluding GHG sources and sinks. The emission sources and sinks included or excluded varies by protocol. The direct and indirect emissions associated with baseline and project N management for each protocol are shown in Table 3. Direct emissions are included in the emissions of N2O from N fertilizer addition to the project lands for enhancing crop productivity. The indirect emissions are included in the N2O emissions that occur beyond the project site but are the result of N fertilizer applied at the project field site. Indirect N2O emissions result from the re-deposition of volatilized ammonia, leaching of N from the soil, and N runoff to surface waters (Intergovernmental Panel on Climate Change, 2006). Depending on the protocol, the boundary may also include combustion emission sources and sinks from fertilizer manufacture, fertilizer distribution, or N application to the field.
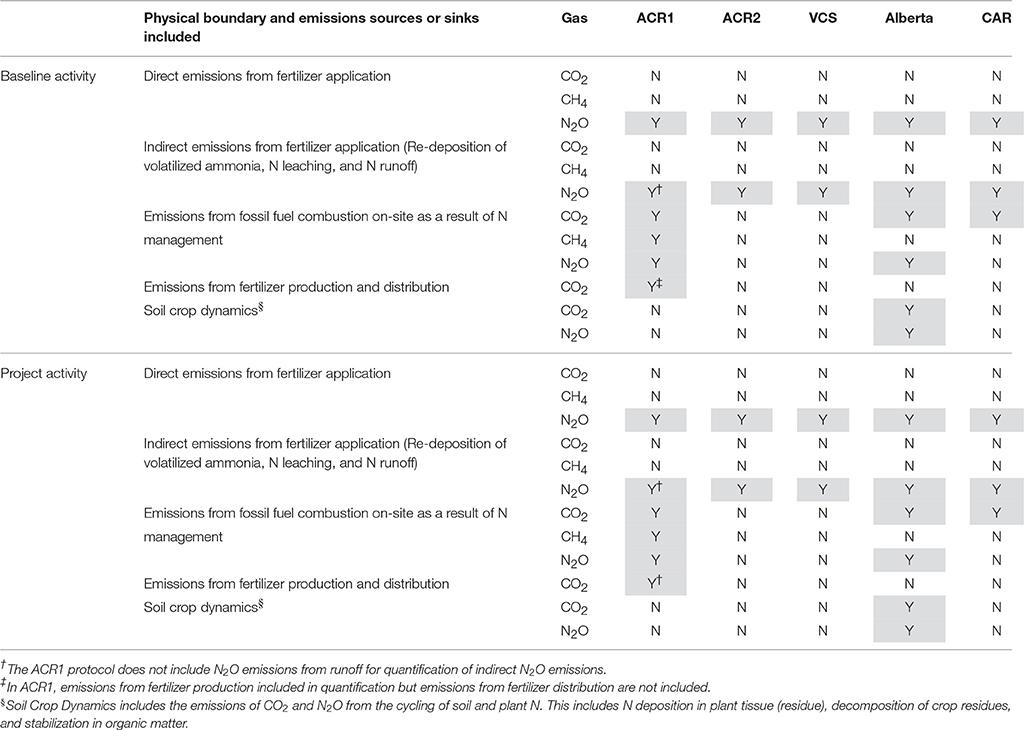
Table 3. Emission sources and sinks included in quantification of baseline and project N2O emissions by protocol.
Additionality
Additionality for these protocols was based on a performance standard of reducing the N fertilizer application rate on project lands, and subsequently N2O emissions, below that of the baseline. It is important that protocol quantification methodologies assure offsets generated by a project are real, not a result of inaccurate quantification, and exceed common practice. The ACR2 and VCS baseline N2O emission calculation used the same number of historical crop years and depend on the crop rotation (Table 4). The number of crop years ranges from 2 to 5 years. The ACR1 protocol specifies five and Alberta three previous crop years. Under CAR, at least three and up to five previous crop years can be used to calculate the baseline N fertilizer rate and N2O emissions.
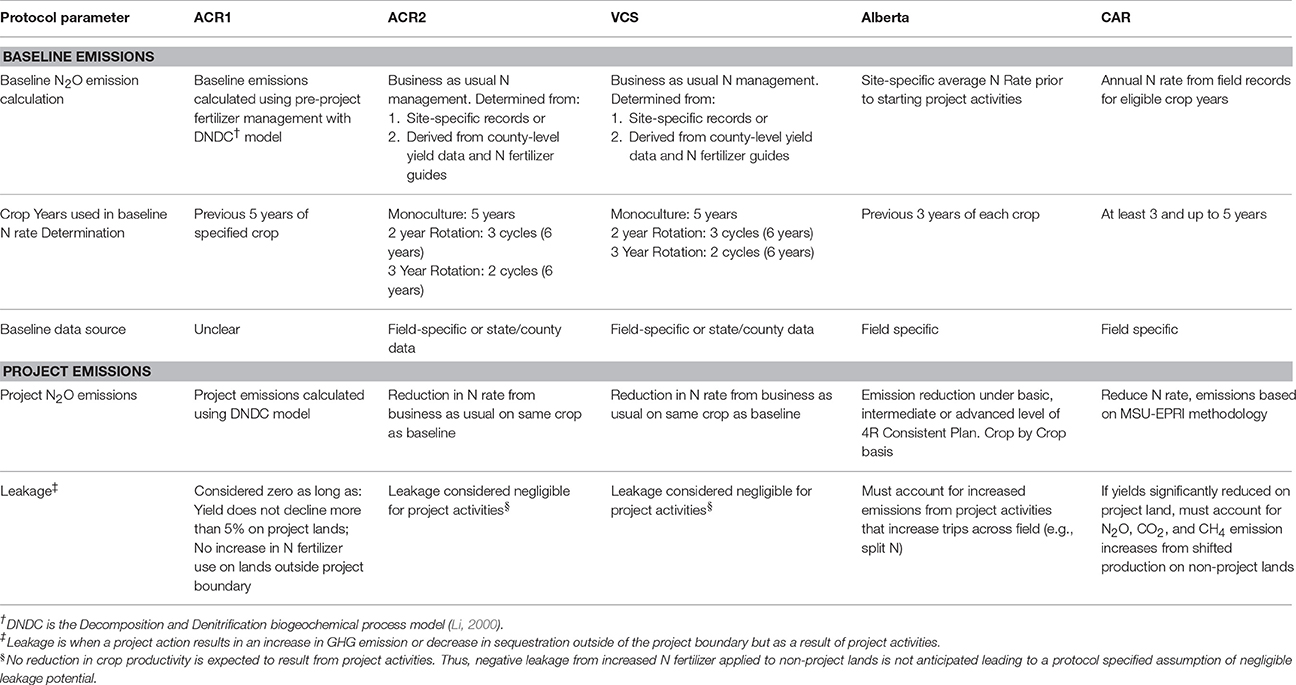
Table 4. Quantification approaches for baseline and project emissions.
Description of Sample Projects
Annual N fertilizer additions are a function of the current crop N demand, N credits from soil-residue N cycling, and inorganic N content in the soil before planting (Koenig, 2005). For this road test, existing N management literature values as well as field specific crop and N management data from the Cook Agronomy Farm Long-Term Agroecosystem Research site (CAF-LTAR), near Pullman, WA were used to develop four sample projects and quantify N2O emission reductions under existing agricultural N management protocols. The CAF-LTAR is under annual cropping and has been direct-seeded since 1998. The soil, agronomic, and field conditions are representative of a “typical” eastern Washington Palouse landscape. The CAF-LTAR receives an average of 550-mm of precipitation and has been under various 3-year dryland cereal crop rotations. The winter wheat—spring wheat—spring legume crop rotation was used for the sample projects, and represents a typical rotation for the eastern WA region of the iPNW (Papendick, 1996; Rasmussen et al., 1998).
Emission reductions were quantified on a crop event basis and offset credits were only generated for each year the credited crop was grown and managed under project conditions. Hard red winter wheat (HRWW) and hard red spring wheat (HRSW) classes were grown in the rotation during the first 10 years of crop production at the CAF-LTAR (2001–2009) followed by soft white winter wheat (SWWW) and soft white spring wheat (2010–2017). For the field specific hard red wheat data, average yield and N fertilizer rates were calculated from the 9 years of data at CAF-LTAR. Field specific SWWW data from a 2010–2012 study at CAF-LTAR was used for SWWW calculations (Brown, 2015). The sample projects were designed to represent feasible agricultural N practices for achieving both high grain yield and optimum protein concentration under dryland conditions in southeastern Washington. It is recognized that these sample project activities represent science-based and commercially viable N fertilizer rate reduction strategies but may not represent the entire range of project circumstances that might arise in practice. To improve the general applicability of this project, the N2O emission results were reported on a land area basis (i.e., per hectare basis).
Sample Projects 1 Through 3: Switch from Uniform to Variable Rate N Application
For SWWW under sample project 1, we assumed that site specific N management could, on average, result in a 25 kg N ha−1 decrease in N fertilizer rate compared to uniform N management without decreasing yield (Mulla et al., 1992; Fiez et al., 1994a; Huggins, 2010; Taylor, 2016). For HRWW and HRSW under sample projects 2 and 3, we assumed that site specific N management could, on average, result in a 10 and 20 kg N ha−1 decrease in N fertilizer rate compared to uniform N management without decreasing yield or grain protein concentration, respectively (Huggins, 2010). The mean N rate reduction under all wheat classes in sample project 1 were considered a realistic N rate decrease that could be achieved by variable rate (VR) N management and also likely acceptable to farmers. However, these N rate decreases were likely to be most appropriate and less risky only in low-yield management zones only rather than the entire field (Huggins, 2010; Taylor, 2016). Increased N rates in high-yielding zones were not expected to negate N rate reductions in low-yielding zones as greater N mineralization under favorable conditions would likely supply greater N to meet a higher crop N demand under this circumstance. Low-yielding areas were assumed to cover ~30% of a field to allow for scaling GHG offsets to the field-scale (i.e., 30% of the 37 ha CAF-LTAR). This number could be adjusted to match field-specific knowledge or historical yield data.
Sample Project 4: N Rate Reductions from Split N Application
Under sample project 2, we assumed that split N application in SWWW could reduce overall N rates by 40 kg N ha−1 compared to all fall N application without decreasing yield (Sowers et al., 1994; Huggins, 2010). To date, no consistent N rate reductions have been observed under split N application for HRSW, though in 1 year an N savings of 19 kg N ha−1 was observed by Huggins (2010). There was concern that the mean N rate reduction under sample project 4 may be greater than what would be acceptable to farmers but the N rate decrease from split N application was considered applicable across the entire field rather than just the low-yielding areas as in sample projects 1 through 3.
Summary of Sample Projects
Sample Project 1 (SWWW-VR):
Wheat Class—soft white winter wheat.
N Management Activity—switch from uniform N to variable rate N fertilizer application.
Project N Fertilizer Rate Reduction Compared to Baseline—25 kg N ha−1
Sample Project 2 (HRWW-VR):
Wheat Class—hard red winter wheat
N Management Activity—switch from uniform N to variable rate N fertilizer application.
Project N Fertilizer Rate Reduction Compared to Baseline—10 kg N ha−1
Sample Project 3 (HRSW-VR):
Wheat Class—hard red spring wheat.
N Management Activity—switch from uniform N to variable rate N fertilizer application.
Project N Fertilizer Rate Reduction Compared to Baseline—20 kg N ha−1
Sample Project 4 (SWWW-Split N):
Wheat Class—soft white winter wheat.
N Management Activity—switch from an all fall N fertilizer application to split applying N fertilizer between the fall and spring.
Project N Fertilizer Rate Reduction Compared to Baseline—40 kg N ha−1
Evaluating Quantification Approaches
Impact of Data Source for Baseline Emissions
Offset quantification methodologies also specify approved data sources for calculating baseline emissions. Field specific data is required under the Alberta and CAR quantification methodologies. The ACR2 and VCS protocols provide the option of using field specific data or county level data to determine the baseline N rate contributing to baseline N2O emissions. Baseline fertilizer N rates calculated from county level data required a yield goal estimate calculated from county level yield records available from the USDA-National Agricultural Statistics Service (USDA-NASS, 2007–2010) and yield-goal based N recommendations obtained from regional fertilizer guides (e.g., Koenig, 2005). Two years of county level yield data for winter wheat were obtained from 2007 to 2010 and for spring wheat from 2008 to 2011 yield data (Brown, 2015). The winter and spring wheat years for county level data were chosen to reflect the two most recent years that those crops were grown in the rotation used at CAF-LTAR for sample project scenarios as specified in ACR (American Carbon Registry, 2012). We compare the implications of each data source on the overall emission reduction estimate.
Impact of Emission Factor for Direct N2O Emissions
The default direct and indirect emission factors for calculating N2O emissions from fertilizer N application to a project field are specified in each offset protocol (Table 5). Generally, direct emission factors are determined by geographic location, crop, and the level of existing peer-reviewed literature available. Where regional peer-reviewed data is lacking for a crop or cropping system, Intergovernmental Panel on Climate Change (IPCC) methodology is the default for estimating N2O emissions (Tier I). The IPCC default emission factor is that 1% of N fertilizer applied is lost as direct N2O emissions from the field. The IPCC default indirect N2O emission factors for volatilization and leaching are 0.1 and 0.75%, respectively (Table 5). Limited regional data showed that the direct emission factor for PNW cropping systems may be much lower than the 1% emission factor used under IPCC Tier I methodology. A Tier II approach was evaluated using a direct emission factor of 0.2% for the PNW (Cochran et al., 1981; Yorgey and Kruger, 2015) and compared to the Tier I factor of 1% across the four sample projects to highlight how regional values would impact the magnitude of mitigation potential for the iPNW.
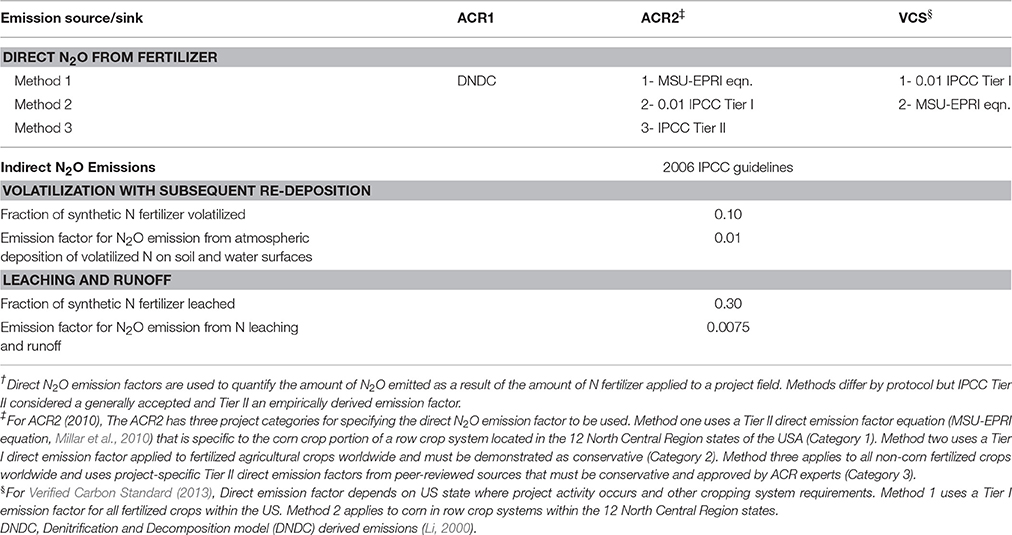
Table 5. Comparison of approaches for calculating direct† and indirect N2O emissions.
Results
PNW Relevant Protocols for Agricultural N Management Offset Credits
Based on the regional scope of each program, only three of the five quantification protocols for agricultural N2O emission offsets could be used to quantify voluntary offsets for the PNW (Table 1). Those were ACR1, ACR2, and VCS. However, the ACR1 specified use of the Denitrification and Decomposition (DNDC) model for quantification of baseline and project emissions and was not used as the expertise needed to complete the model N2O emission quantification was found to be outside the scope of this project (Li, 2000). Emission reductions were quantified for the sample projects using only the ACR2 and VCS protocols as they were found to be the most applicable and appropriate for PNW wheat-based agriculture. No GHG offset projects for agricultural N management had been registered under ACR, CAR, or VCS at the time this research was completed (Table 1). However, VCS had the largest number of other GHG projects registered (1,409 projects; ~200 million metric tons CO2e offsets issued) followed by CAR (479 projects; ~87 million metric tons CO2e offsets issued), Alberta (229 projects, ~118 million metric tons CO2e offsets issued), and ACR (216 projects; ~81 million metric tons CO2e offsets issued) (Table 1).
Sources and Sinks Included in Emission Quantification
There were differences among the protocols as to the N fertilizer sources credited under the offset quantification methodology (Table 2). The ACR, VCS, and Alberta protocols issue emission offset credits for N rate reductions from both inorganic and organic N sources. Under CAR, the N rate reduction included both synthetic and organic N sources but only synthetic N fertilizer source reductions could be credited for N2O emission reductions. The Alberta protocol was unique in that quantification of N inputs from crop residue decomposition were included (Table 2). Approved N management practices in the N2O offset protocols reviewed differed among protocols but generally appeared to encourage adoption of precision agriculture principles and use of N fertilizer stabilizer technology (e.g., nitrification inhibitors) (Table 2). Differences in eligible project start dates may have implications for driving innovation and adoption of GHG reduction techniques or technologies but did not appear to impact offset quantification. There were also some differences in regulatory surplus requirements among protocols. However, our projects were not designed to focus on these parameters.
The emission sources included in calculating N2O emission reductions from project activities differed among protocols (Table 3). On-site fossil fuel emissions were included in the ACR1, Alberta, and CAR protocols. The ACR2 and VCS quantification methodologies did not include any fossil fuel combustion emissions from N management, fertilizer production and distribution, or soil crop dynamics. The ACR1 protocol included CO2, CH4, and N2O from on-site fossil fuel combustion. The Alberta protocol included CO2 and N2O from on-site fossil fuel combustion during N management as well as the inclusion of CO2 and N2O emissions from soil crop dynamics. The CAR protocol included only CO2 from fossil fuel combustion. The ACR1 protocol was the only methodology to include CO2 emissions from N fertilizer production though it did not include N fertilizer distribution emissions. Another difference among protocol quantification methodologies was the exclusion of indirect N2O emissions from runoff in the ACR1 protocol. The other four protocols included indirect N2O from N runoff as well as N2O emissions from re-deposition of volatilized N and N leaching.
Additional to Business as Usual
Overall, the protocols differed slightly in the number of years of historical crop data used to calculate the baseline N fertilizer rate (Table 4). In our study, we used three historical crop years for baseline quantification given the 3-year crop rotation at CAF-LTAR, as specified in the ACR2 and VCS protocols (Table 4). However, the number of crop years to calculate baseline N fertilizer rate and N2O emissions ranged among the protocols from 2 to 5 years (Table 4). The ACR1 protocol specified 5 and Alberta 3 previous crop years. Under CAR, at least 3 and up to 5 previous crop years could be used to calculate baseline N fertilizer rate and subsequent baseline N2O emissions.
Differences in the approved data sources for calculating baseline N2O emissions were also observed (Table 4). Field specific data was required under the Alberta and CAR quantification methodologies. For ACR2 and VCS, baseline N fertilizer rate can be calculated using one of two approaches. One approach relied on field specific N application records from the project field for the specified number of crop years prior to the project (Table 4). The other approach utilized county level data to estimate N application rates for the specified number of crop years prior to the project. The number of crop year data for calculating the average yield goal for the county level estimate of baseline emissions was the two most recent years since the project scenarios were developed assuming a three-year crop rotation (Table 4).
N2O Emissions by Protocol and Baseline Approach
The ACR2 and VCS protocols had identical baseline and project emission quantification methodologies (e.g., using the same default factors for direct and indirect emissions). This resulted in the same baseline, project, and emission reduction values under the two protocols for all four sample projects (Figure 2) with no differences observed between these protocols for the sample projects considered. Reducing N fertilizer application rate by switching to variable rate N (sample projects 1-3) or split N application (sample project 4) management resulted in an estimated N2O emission reduction of 0.16, 0.07, 0.14, and 0.26 Mg CO2e ha−1 for SWWW-VR, HRWW-VR, HRSW-VR, and SWWW-Split N sample projects, respectively. Variable rate N management for HRWW (sample project 2) resulted in the least amount of emission offsets compared to variable rate N under SWWW or HRSW (Figure 3). The highest N2O emission reduction from N management project activities was observed under split N application in SWWW. The highest emission reductions occurred where the greatest N rate reductions were estimated from the literature and decreased by sample project accordingly: SWWW-Split N (40 kg N ha−1 reduction) > SWWW-VR (25 kg N ha−1 reduction) > HRSW-VR (20 kg N ha−1 reduction) > HRWW-VR (10 kg N ha−1 reduction) (Table 6).
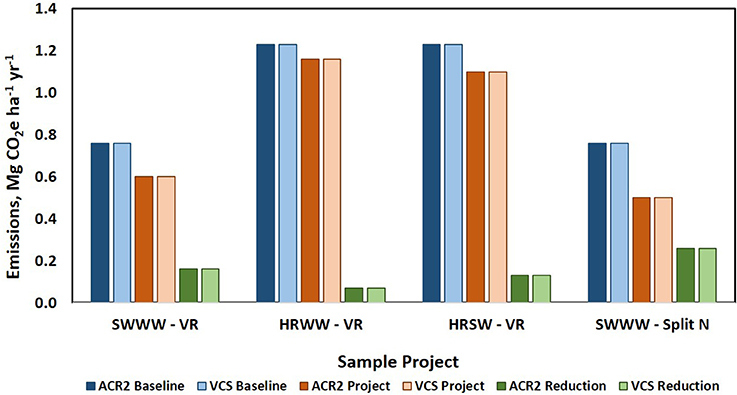
Figure 2. Baseline, Project, and Offset (Reduction) Emissions by American Carbon Registry (ACR2) and Verified Carbon Standard (VCS) Protocols. For quantification used field scale data from Cook Agronomy Long-term Agroecosystem Research Farm, IPCC Tier I direct emission factors, and IPCC default indirect emission factors to determine N2O emission reductions from management changes for: SWWW-VR, soft white winter wheat uniform to variable rate N (Sample Project 1); HRWW-VR, hard red winter wheat uniform to variable rate N (Sample Project 2); HRSW-VR, hard red spring wheat uniform to variable rate N (Sample Project 3); and SWWW-Split N from all fall to split N application between fall and spring (Sample Project 4).
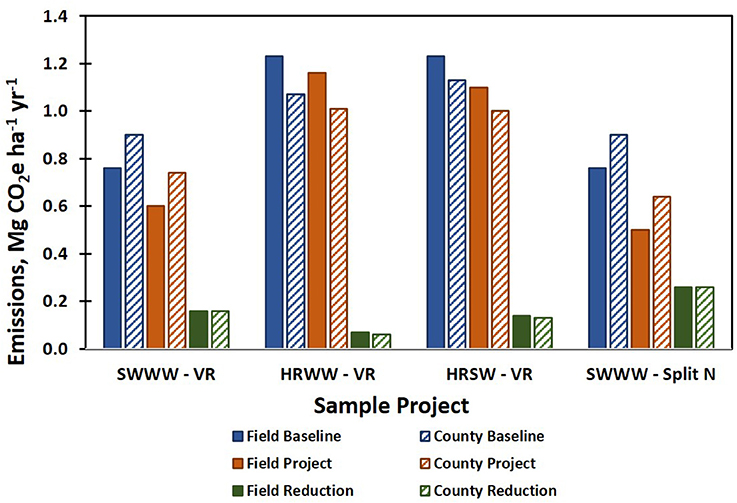
Figure 3. Comparison of Baseline, Project and Offset (Reduction) Emissions Using Field Specific or County Level Data to Determine Baseline Emissions. American Carbon Registry Quantification Methodology, Tier I IPCC direct emission factor and IPCC default indirect emission factors used. Field specific N application records from CAF-LTAR were used to determine N2O emission reductions from management changes for: SWWW-VR, soft white winter wheat uniform to variable rate N (Sample Project 1); HRWW-VR, hard red winter wheat uniform to variable rate N (Sample Project 2); HRSW-VR, hard red spring wheat uniform to variable rate N (Sample Project 3); and SWWW-Split N from all fall to split N application between fall and spring (Sample Project 4).
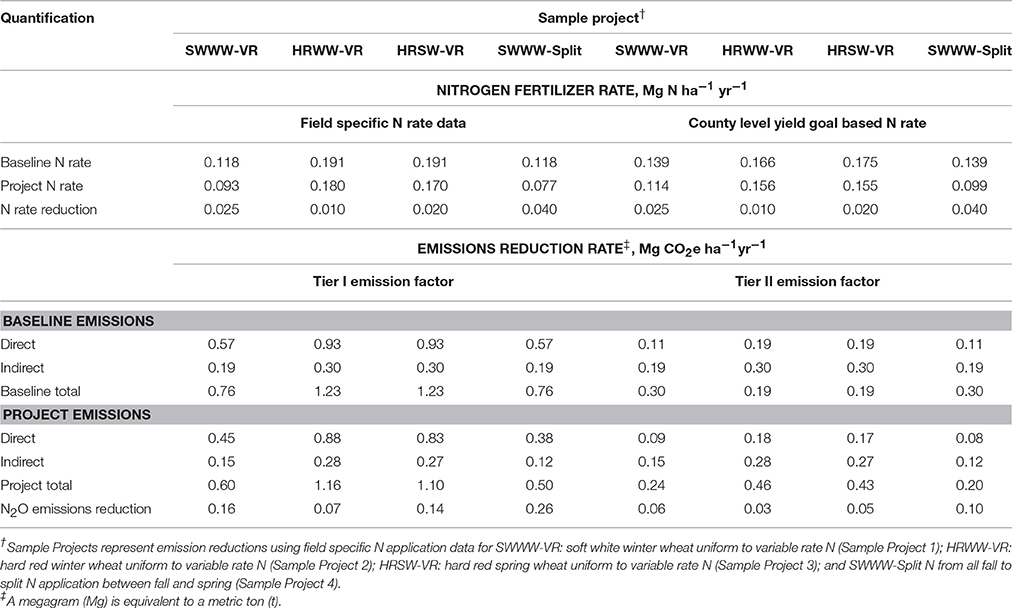
Table 6. Direct and indirect emissions for baseline and project conditions under different baseline and direct N2O emissions quantification methodologies.
Approaches for Quantifying Baseline N2O Emissions
The approach used in determining baseline N2O emissions impacted the quantity of baseline emissions and hence relative magnitude of N2O emission reductions from project activities (Figure 3). The difference in baseline N2O was more pronounced for the sample projects with SWWW compared to the sample projects with HRWW and HRSW. Using county level yield data to estimate the baseline N fertilizer application for SWWW in sample projects SWWW-VR and SWWW-Split N resulted in baseline emissions of 0.90 Mg CO2e ha−1 compared to 0.76 Mg CO2e ha−1 using historical field N application records. The county level estimated N fertilizer rate resulted in HRWW baseline emissions of 1.07 Mg CO2e ha−1 and HRSW of 1.13 Mg CO2e ha−1 compared to 1.23 Mg CO2e ha−1 using historical field N application records (Figure 3). This was due to using 2 years of county level data for a yield goal based N fertilizer recommendation rate that resulted in a higher baseline N fertilizer rate for the SWWW in sample projects SWWW-VR and SWWW-Split N (0.139 Mg N ha−1) and a lower baseline N fertilizer rate for sample projects HRWW-VR and HRSW-VR of 0.166 and 0.175 Mg N ha−1, respectively (Table 6). This was compared to historic field specific N rates of 0.118, 0.191, 0.191, and 0.118 Mg N ha−1 for the different wheat in sample projects SWWW-VR, HRWW-VR, HRSW-VR, and SWWW-Split N, respectively (Figure 3).
N2O Emissions Using Tier I vs. Tier II Direct Emission Factors
All four of the protocols reviewed did not have N2O emission factors specific to iPNW wheat-based cropping systems. The ACR2 and VCS protocols specify a Tier II emission factor equation to be used for direct N2O emissions from N fertilizer additions to corn crops in row crop agriculture within the 12 North Central Region states (Millar et al., 2010), with remaining agricultural crops defaulting to the IPCC Tier I emission factor (Table 5). This means that IPCC Tier I default factors must be used to calculate emission reductions from sample project activities (i.e., 1% of nitrogen fertilizer rate lost as N2O) since no other Tier II equations have been accepted for other crops. However, limited regional data showed that the direct emission factor for iPNW cropping systems may be much lower than the IPCC Tier I methodology default (Cochran et al., 1981; Yorgey and Kruger, 2015). Using a Tier II approach and assuming a direct emission factor of 0.2% of the N fertilization rate for wheat resulted in the generation of offset credits that were 2.3–2.8 times lower compared to the Tier I emission factor (Figure 4). Emission reductions using the Tier I direct emission factor of 1% resulted in a 0.16, 0.07, 0.14, and 0.26 MgCO2e ha−1 yr−1 emission reductions for SWWW-VR, HRWW-VR, HRSW-VR, and SWWW-Split N sample projects, respectively. In comparison, Tier II emission reductions using a direct emission factor of 0.2% resulted in a 0.06, 0.03, 0.05, and 0.10 Mg CO2e ha−1 yr−1 reduction in N2O emissions for sample projects SWWW-VR, HRWW-VR, HRSW-VR, and SWWW-Split N, respectively. Interestingly, for this analysis only the direct emissions changed and the default indirect emissions remained the same for each sample project (Table 6).
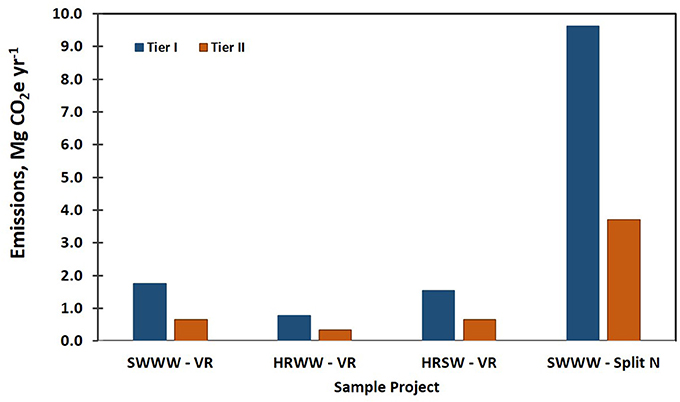
Figure 4. Offset Credits for Project Activities under Tier I and Tier II Direct N2O Emission Factors. The IPCC Tier I default of 1% (blue) and potential Tier II emission factor of 0.2% (orange) of N fertilizer applied. The IPCC default indirect emission factors were used. Data represent field specific N application data from CAF-LTAR for sample projects. The American Carbon Registry Quantification Methodology was used to determine N2O emission reductions from management changes for: SWWW-VR, soft white winter wheat uniform to variable rate N (Sample Project 1); HRWW-VR, hard red winter wheat uniform to variable rate N (Sample Project 2); HRSW-VR, hard red spring wheat uniform to variable rate N (Sample Project 3); and SWWW-Split N from all fall to split N application between fall and spring (Sample Project 4).
Market Size for Washington State
Field-scale emission reductions in this study, using the CAF-LTAR, were 1.18, 0.71, 1.42, and 9.55 Mg CO2e yr−1 under Tier I as compared to 0.70, 0.31, 0.59, and 3.88 Mg CO2e yr−1 under Tier II for sample projects SWWW-VR, HRWW-VR, HRSW-VR, and SWWW-Split N, respectively (Table 7). The potential revenue that could be generated per hectare from reducing N2O emissions through agricultural N management offset projects in the higher precipitation zone of the dryland PNW are shown in Table 7. Sample project four, SWWW-Split N, had the highest per hectare payment incentive followed by sample projects SWWW-VR, HRSW-VR, and HRWW-VR (Table 7). At a carbon price of $10 per MgCO2e, offset credits generated would be worth $1.60, $0.70. $1.30, and $2.60 ha−1 yr−1 for sample projects SWWW-VR, HRWW-VR, HRSW-VR, and SWWW-Split N, respectively.
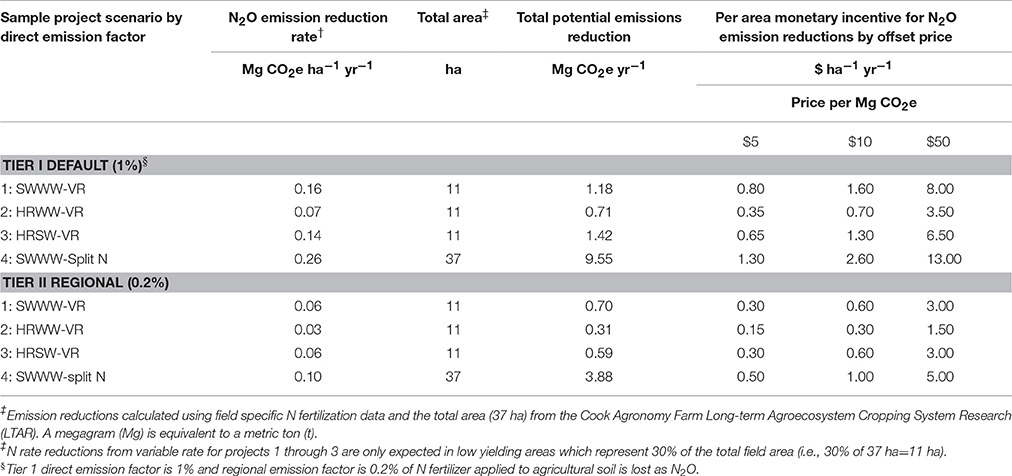
Table 7. Nitrous oxide emission reduction potential and offset credit incentive for the agricultural N management sample projects†.
The monetary incentive was substantially increased when the cost savings on N fertilizer was included with the offset payment incentive (Table 8). At average anhydrous ammonia prices for 2006–2011, the N fertilizer cost savings that could be added to the GHG offset credit incentive was $21, $9, $18, and $35 ha−1 yr−1 for sample projects SWWW-VR, HRWW-VR, HRSW-VR, and SWWW-Split N, respectively (Table 8). This creates a payment incentive that ranges from $9 to $48 ha−1 yr−1 under Tier I and $9 to $40 ha−1 under Tier II methodologies across all carbon prices. Though still relatively small, the direct N2O emission factor had a considerable effect on the overall monetary incentive from N2O emission reduction offset credits.
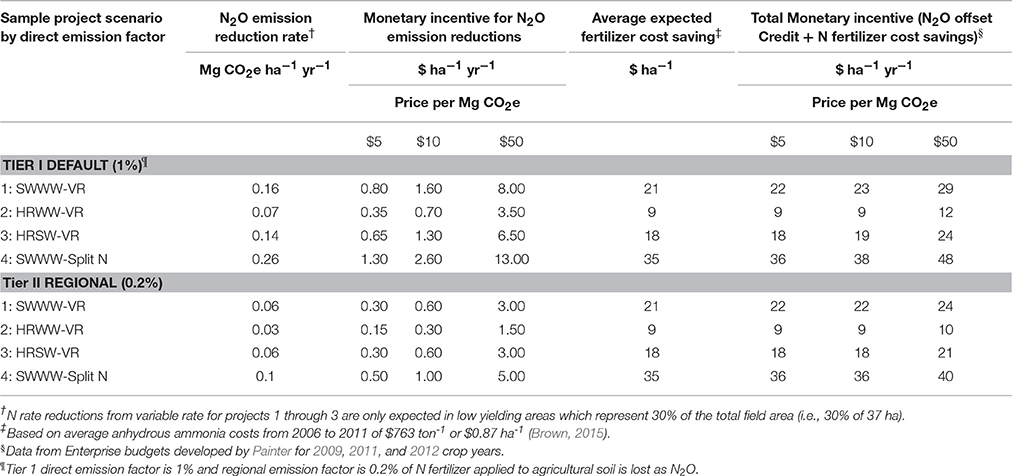
Table 8. Including the fertilizer cost savings for calculating the offset credit incentive for the agricultural N management sample projects that reduce N2O emissions.
In 2011, there were ~630,000 hectares of SWWW, 86,000 hectares of HRWW, and 124,000 hectares of HRSW grown in WA State (United States Department of Agriculture, National Agricultural Statistics Service (USDA-NASS), 2011). This would result in an estimated potential annual carbon offset market size of 10.1, 0.6, 1.6, and 16.4 Gg CO2e yr−1 for SWWW-VR, HRWW-VR, HRSW-VR, and SWWW-Split N sample projects, respectively, if 10% of the crop land acreage for the market class was under the sample project N management (Table 9). Greater emission reductions could be achieved with greater adoption of sample project N management with as much as 82 Gg CO2e yr−1 generated by sample project SWWW-Split N under a fifty percent adoption on soft white winter wheat acreage.
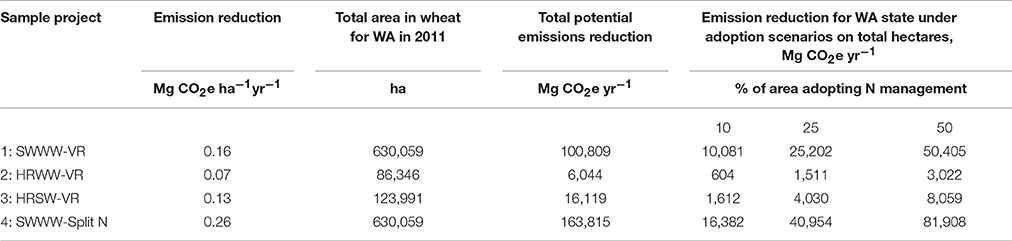
Table 9. Total potential annual emission reductions for Washington state under different n management adoption scenarios for each sample project using 2011 Washington Wheat Facts (Washington Wheat Commission, 2011).
Discussion
Review of Agricultural N Management Protocols: Components and Relevance to iPNW
Consistency across GHG protocols for quantifying voluntary offset credits is needed to provide high quality offset credits and develop large-scale offset markets that support practical climate policy solutions (Kollmuss et al., 2010; Erikson and Lazarus, 2013; Lee et al., 2013). Methodologies for quantifying N2O emissions reductions have been developed for agricultural N management, but key elements within available protocols need to be reviewed periodically. Evaluating existing protocols for GHG emission reductions from agricultural N management applicable to iPNW wheat cropping systems illustrated differences in policy and technical approaches to quantifying N2O emission reductions. Differences in eligible conditions, boundaries for baseline, project and leakage activities, and the data and default values for emission reduction quantification observed across the five agricultural N management protocols in this study have been observed in protocol reviews for other project types (Kollmuss et al., 2010; Lee et al., 2013). Identifying the nature of GHG program or protocol differences will be critical to developing appropriate policy tools and ensuring consistency in the quantity and quality of each offset ton generated by a project and entering the carbon market (Erikson and Lazarus, 2013; Lee et al., 2013).
Overall, the eligible N management practices required to achieve the performance levels in the ACR1, ACR2, VCS, Alberta, and CAR protocols aligned with implementing the principles of precision agriculture including improved prediction of crop N demand and enhanced N use efficiency. Precision N fertilizer management (otherwise known as variable rate) has been considered one of the most practical strategies for improving agricultural N-use efficiency and reducing N loss to unintended portions of the environment (Cassman et al., 2002; Robertson and Vitousek, 2009). Adoption of precision N management has been slow in the US (Cassman et al., 2002) and especially in the iPNW (Pan et al., 2007; Huggins, 2010). Participation in carbon markets could enhance adoption of innovative precision N management that is practical, economically feasible, and capable of feeding a growing world population. One insight from this review was inconsistency in specifying approved N management practices. From a policy standpoint, protocols that refer project developers to state best management practices (i.e., ACR2 and VCS) were less clear on approved N management practices compared to other protocols that specified N fertilizer rate reducing actions. However, there appeared to be sufficient performance outcome specificity (i.e., reduce N rate below baseline) that less defined management practices might be critical in supporting grower driven on-farm innovations in reducing N fertilizer rates.
Another key finding from this research was that the fossil fuel emissions, excluded in the ACR2 and VCS protocols, could be an important, but relatively small source of GHG emissions under currently approved project activities if N fertilizer management changes result in increased fossil fuel consumption (e.g., more trips across the field for split application of N). Exclusion of emissions from fertilizer production and distribution under ACR2 and VCS protocols were also noted and could potentially be a large source of GHG emissions. However, such source or sink exclusions in the ACR2 and VCS methodologies could be justified as increasing the conservativeness of the project. These exclusions would be expected to create differences in the quantity and quality of offsets generated across protocols. Carbon sequestration was not included in any of the protocols reviewed because N fertilizer rate reductions were not expected to impact soil C stocks and would further increase the conservativeness of the N2O offset quantification (American Carbon Registry, 2012; Millar et al., 2012).
Differences in the approved data sources for calculating baseline N2O emissions observed could result in different baseline N2O emissions which impact the magnitude of offsets generated by a project. Differences in the number of pre-project crop years used to quantify baseline N2O emissions would be expected to result in different emission reductions among the five protocols. Currently relevant protocols (ACR2 and VCS) did not have emission factors specific to iPNW wheat cropping systems. We also observed that using IPCC Tier I default methodology may dramatically over-estimate gross N2O emissions. The ACR2 and VCS protocols generated identical emission reduction offsets limiting the ability to determine the impact of differences in quantification methodologies. However, the lack of consistency across sources and sinks and in default factors across all five protocols could contribute to inequities in offset credits generated under the different programs. Ensuring each “ton is a ton” across offset programs requires better congruency among quantification approaches in approved protocols (Lee et al., 2013). This could be investigated in future efforts by relaxing location eligibilities and running the road test on all existing agricultural N management protocols (e.g., Alberta protocol).
Quantify N2O Emission Reductions under Applicable Protocols using Sample Projects
The emission reductions in this road test, ranging from 0.07–0.26 Mg CO2e ha−1 yr−1, were at the lower end reported by Eagle et al. (2012) but similar to those reported by Millar et al. (2010) for Midwest corn using linear direct emission factors. Nitrous oxide emission reductions from agricultural N management have been estimated to potentially provide voluntary GHG offsets on the order of 0.2–0.6 and 0.09–0.15 Mg CO2e ha−1 yr−1 in Eagle et al. (2012) and Millar et al. (2010), respectively. In this study, project N rate reductions of 21, 6, 11, and 35% of the baseline for SWWW-VR, HRWW-VR, HRSW-VR, and SWWW-Split N sample projects, respectively, were considered feasible N rate reductions as generated from the literature for variable or split as compared to uniform or all fall N management. Specifically, the N rate reduction at this level seemed appropriate without contributing to a reduction in crop yields (CAST, 2004; Millar et al., 2010; Eagle et al., 2012).
Impact of Quantification Approaches on Offsets Generated
Quantification of sample project emissions in this study, following the work of Lazarus et al. (2010) and Lee et al. (2013), improved understanding of the differences in agricultural N management protocols and subsequent implications in the generation of GHG offsets for the carbon market. The results of this study highlighted the value of regionally applicable protocols for quantifying emissions and emission reductions. Historical and current research show that the direct emission factor for Washington cropping systems may be much lower than 1% of N fertilizer additions used under IPCC Tier I methodology. The IPCC methodology recognizes that the 1% of N fertilizer rate emission factor for direct N2O emissions may be good for global inventories but not for quantifying regional N2O emissions (Intergovernmental Panel on Climate Change, 2006). In addition, an earlier study in the iPNW showed that N2O emissions were not a linear function of N rate as is assumed using IPCC Tier I methodology (Cochran et al., 1981). Under the IPCC methodology, the direct and indirect emissions from application of N fertilizer to agricultural soils are calculated according to a three tier approach (Intergovernmental Panel on Climate Change, 2006). As quantification methods move from a Tier I to Tier III emission factor approach, the uncertainty in the emission quantification is reduced (i.e., improved accuracy). This is a result of better accounting for regional differences in environmental conditions and management practices (Intergovernmental Panel on Climate Change, 2006). However, determination of emission factors under the Tier II and Tier III approaches are more complex and expensive to determine (Bracmort, 2011).
The review and road test of current agricultural N management protocols showed that some improvements could be made to ensure quantification approaches are applicable to more regions, and in particular for the iPNW dryland wheat-based cropping systems. Development of an iPNW focused agricultural N management protocol should utilize an agroecological zone approach (Huggins et al., 2014) in developing regional emission factors and evaluating GHG emission reductions from project activities to better reflect local conditions and management practices. This could be informed by the Ecodistrict approach used in the Alberta protocol (Alberta Environment, 2010). In addition, the Alberta protocol offered three performance levels within the Consistent 4R Nitrogen Stewardship Plan: basic, intermediate, and advanced with a greater amount of field variability addressed and more complex BMPs adopted as a participant moves to the intermediate and advanced levels. New N management protocols can be submitted to these programs to improve applicability to regional or cropping system specific conditions. New protocols must be reviewed and approved before they can be used under a program. Nevertheless, as discussed here, given the relatively small economic incentive offsets are likely to provide iPNW wheat farmers, further protocol revisions may not seem worthwhile. However, for other practice-based incentives these iPNW-specific quantification approaches, as well as some parameters from the offset protocols, could serve as the basis for payments or proactive accounting of ecosystem services provided by agricultural BMPs.
The accuracy of emission reductions for the iPNW could also be improved through development of regional emission factors (Tier II or Tier III) and might be achieved through field measurements or employing existing biophysical models, such as CropSyst (Stockle et al., 2012), and assessment frameworks, such as BioEarth (Adam et al., 2014). However, lower input models (e.g., COMET-Farm) rather than high input process-based models (e.g., CropSyst, DNDC) would likely reduce transaction costs associated with project development and verification (Li, 2000; Stockle et al., 2012). In particular, the relationship between N rate and N2O emissions should be considered in developing accurate emission factors if quantification methodologies continue to estimate N2O emissions based on N fertilization rate.
An N2O emission reduction protocol for the iPNW would be strengthened by including additional performance metrics such as the nitrogen-use efficiency metric used in the CAR (Climate Action Reserve, 2012) protocol [Removed to Applied (RTA) = N removed/N applied]. This may be added as a monitoring requirement only or implemented as a performance standard in addition to N fertilizer rate reduction. The performance could require an improvement in nitrogen-use efficiency over the baseline nitrogen-use efficiency. This would also improve the ability of project developers and climate policy to avoid crop yield reductions in more efficient agroecosystems and thus reduce leakage of emissions from these type of management efforts (Eagle et al., 2012). In addition, decision support to understand the conditions under which precision N management actually reduces N rate without reducing yield is needed. This is especially important for managing the economic risk of underapplying N.
Are Offset Payments Enough to Impact N Management Decisions?
The potential revenue farmers could earn by participating in the carbon market were examined to understand the relative importance of the incentive for encouraging adoption of improved N management. In general, the offset credit incentive payment alone did not appear to be enough to impact N management changes to participate in GHG offset markets at offset prices of $5, $10, or even $50 per MgCO2e. Though the incentive becomes more appealing at $50 per MgCO2e, the cost to implement variable or split N rate as well as costs for project development and verification are likely to outweigh the incentive payment. Adding the N fertilizer cost savings increased the incentive payment to a point that is more comparable with the potential return from the management changes of the sample projects. The incentive for switching from uniform to variable N management or from all fall N application to splitting the N fertilizer between fall and spring would have to be similar or greater than the cost to adopt these changes or risk to under applying N in order to stimulate adoption.
Precision agriculture techniques make use of fertilizer N rate, timing, placement, and formulation to match N supply with crop demand (Robertson and Vitousek, 2009). An overall N rate decrease can often, but not always, be realized by applying one or more of these principles (Huggins, 2010). In evaluating the potential to generate GHG offset credits from agricultural N management for a particular region, it is important to consider the tradeoffs and what level or type of incentive is needed to influence N management decisions. Adoption of precision agriculture techniques within the iPNW generally lacks sufficient decision support (Pan et al., 1997; Huggins, 2010) and monetary incentives. Furthermore, managing N in cropping systems involves consideration of the total N supply needed for not only supporting crop growth but also achieving grain yield and quality (Huggins and Pan, 2003). Therefore, N fertilizer rate reductions will likely be seen as economically risky and require a monetary incentive that compensates for the risk of under applying N (Robertson and Vitousek, 2009; Huggins, 2010).
Leakage provisions in agricultural N management protocols specify that N rate reductions must not result in a decrease in yield. Though not addressed in current protocols, it should be noted that farm economics would also require any N rate reductions to not come at the expense of yield quality (e.g., protein concentration specifications for the wheat market class). Maintained yield with less N is believed to be possible because typical yield-goal based N fertilizer recommendations tend to overestimate N requirements (Millar et al., 2012). This could be especially true for winter wheat crops in the PNW because it is difficult to accurately estimate yield goal at the time of planting and N fertilizer application. For dryland winter wheat, a majority of N fertilizer is applied in the fall when N demand is the lowest. Yield may also be maintained with less N in situations where N is applied in excess of the N requirement to minimize economic risk if growing conditions are exceptional. Insurance applications of N as a means to manage the economic risk of under applying N should not be dismissed. Especially considering that decision support and other incentives are generally lacking for managing the site-specific N requirement. An additional monetary incentive may be needed to cover insurance N fertilizer applications.
Offsets from agricultural N management do not appear to be the best tool for GHG mitigation and reducing additions of reactive N to the environment. The monetary incentive for agricultural N management for N2O emission reductions could be tied to existing conservation programs such as the USDA-NRCS Conservation Stewardship Program to improve the return on investing in GHG emissions reduction activities. There may be co-benefits to encouraging a reduction in N application rate beyond generating GHG emission reductions, such as avoided acidification of soils and water bodies, limiting N leaching impacts on ground and surface water quality, avoided ozone destruction, and reducing the cost of production. Furthermore, the offset credits generated from N2O emission reductions from reducing N fertilizer rate are irreversible. An avoided N2O emission cannot be reversed as is the case for carbon sequestration projects. This means no future obligation for farmers enrolled in a project making them more attractive to offset purchasers.
Conclusions
Differences observed across the five agricultural N management protocols in this study highlighted inconsistencies among protocols. The implications are that there could potentially be discrepancies in the quantity and quality of GHG offsets generated across the different programs. This impacts credibility of carbon markets and limits the ability to offer GHG credits in larger-scale national or global carbon markets. In order to support the participation of iPNW farmers in offset credit markets for N2O reductions, one or more of the existing protocols should be adapted for the region. At least a Tier II direct emission factor will need to be determined or modeled (Tier III) to accurately reflect baseline, project, and overall emissions reductions. However, our assessment found that the financial incentive from the carbon offset credit alone was not likely to encourage any management changes. Nitrogen fertilizer cost savings will be one of the most practical incentives for a farmer to adopt the N management proposed in the sample projects. Therefore, stacking of offset credit revenue, along with other incentive-based approaches, is likely to be required in order to realize N2O emissions reductions in the region that are economically feasible.
Author Contributions
TB performed the offset protocol literature review with guidance from CL, both authors contributed to the writing of this manuscript. TB contributed a majority of the writing. CL provided extensive review of early versions of the analysis and writing for the manuscript. CK provided guidance on policy aspects and manuscript review. DH and JR provided extensive editorial review of the manuscript.
Funding
The authors would like to thank the National Science Foundation funded Nitrogen Systems Policy-Oriented Integrated Research and Education-Integrated Graduate Education and Research Traineeship at Washington State University (NSPIRE-IGERT, 0903714) and the National Institute of Food and Agriculture funded Regional Approaches to Climate Change (REACCH, 2011-68002-30191) program for funding.
Conflict of Interest Statement
The authors declare that the research was conducted in the absence of any commercial or financial relationships that could be construed as a potential conflict of interest.
Acknowledgments
The authors would like to thank the US Center of the Stockholm Environment Institute (SEI) for in-kind support and expertise critical to the project. The authors would also like to acknowledge that the protocol reviews and a separate “road test” were originally reported in the dissertation of Brown (2015).
References
Adam, J. C., Stephens, S. H., Chung, M. P., Brady, R. D., Evans, C. E., Kruger, B. K., et al. (2014). BioEarth: a regional biosphere-relevant earth system model to inform agricultural and natural resource management decisions. Clim. Change 129, 555–571. doi: 10.1007/s10584-014-1115-2
Alberta Environment. (2010). Quantification Protocol for Agricultural Nitrous Oxide Emissions Reductions. Specified gas emitter's regulation. Her Majesty the Queen in right of the Province of Alberta.
American Carbon Registry. (2010). American Carbon Registry Methodology for N2O Emission Reductions through Changes in Fertilizer Management. Arkansas, KS: Winrock International, Little Rock.
American Carbon Registry. (2012). Methodology for Quantifying Nitrous Oxide (N2O) Emissions Reductions from Reduced Use of Nitrogen Fertilizer on Agricultural Crops. Arkansas, KS: Winrock International, Little Rock.
Bracmort, K. (2011). Nitrous Oxide from Agricultural Sources: Potential Role in Greenhouse Gas Emission Reduction and Ozone Recovery. Congressional Research Report R40874. Washington Printing Office.
Broekhoff, D., and Zyla, K. (2008). Outside the Cap: Opportunities and Limitations of Greenhouse Gas Offsets, Climate and Energy Policy Series. Washington, DC: World Resources Institute.
Brown, T. (2015). Variable Rate Nitrogen and Seeding to Improve Nitrogen Use Efficiency. dissertation. Washington State University, Pullman, W. A.
CAST. (2004). Climate Change and Greenhouse Gas Mitigation: Challenges and Opportunities for Agriculture. Task Force Report No. 141. Council for Agricultural Science and Technology, Ames, IA.
Cassman, K. G., Dobermann, A., and Walters, D. T. (2002). Agroecosystems, nitrogen-use efficiency, and nitrogen management. Ambio 31, 132–140. doi: 10.1579/0044-7447-31.2.132
Climate Action Reserve. (2012). Nitrogen Management Project Protocol. Version 1.0. Climate Action Reserve, Los Angeles, CA.
Cochran, V. L., Elliott, L. F., and Papendick, R. I. (1981). Nitrous oxide emissions from a fallow field fertilized with anhydrous ammonia. Soil Sci. Soc. Am. J. 45, 307–310. doi: 10.2136/sssaj1981.03615995004500020016x
Eagle, A., Olander, L., Henry, L. R., Haugen-Kozyra, K., Millar, N., and Robertson, G. P. (2012). Greenhouse Gas Mitigation Potential of Agricultural Land Management in the United States: A Synthesis of the Literature. Report NI R 10-04, 3rd Edn. Durham, NC: Nicholas Institute for Environmental Policy Solutions, Duke University.
Erikson, P. A., and Lazarus, M. (2013). Implications of international GHG offsets on global climate change mitigation. Climate Policy 13, 433–450. doi: 10.1080/14693062.2013.777632
Fiez, T. E., Miller, B. C., and Pan, W. L. (1994a). Assessment of spatially variable nitrogen fertilizer management in winter wheat. J. Prod. Agric. 7, 86–93. doi: 10.2134/jpa1994.0086
Fiez, T. E., Miller, B. C., and Pan, W. L. (1994b). Winter wheat yield and grain protein across varied landscape positions. Agron. J. 86, 1026–1032. doi: 10.2134/agronj1994.00021962008600060018x
Huggins, D. R., and Pan, W. L. (2003). Key indicators for assessing nitrogen use efficiency in cereal-based agroecosystems. J. Crop Prod. 8, 157–186. doi: 10.1300/J144v08n01_07
Huggins, D. R. (2010). “Site-specific n management for direct-seed cropping systems,” in Friendly Farming: Improving the Carbon Footprint of Agriculture in the Pacific Northwest, eds C. G. Kruger, S. Yorgey, H. Chen, C. Collins, C. Feise, D. Frear, S. Higgins, D. Huggins, C. MacConnell, K. Painter, and C. Stöckle. Climate CSANR Research Report 2010-001. Washington State University. (Accessed 09/10/2013) at http://csanr.wsu.edu/pages/Climate_Friendly_Farming_Final_Report/
Huggins, D., Rupp, R., Kaur, H., and Eigenbrode, S. (2014). “Defining agroecological classes for assessing land use dynamics,” in Regional Approaches to Climate Change for Pacific Northwest Agriculture. Climate Science Northwest Farmers Can Use, eds K. Borrelli, D. Daily Laursen, S. Eigenbrode, B. Mahler, and B. Stokes) (Moscow, ID: University of Idaho). Available online at: https://www.reacchpna.org/
Intergovernmental Panel on Climate Change (2006). “Agriculture, forestry and other land use. N_2O emissions from managed soils, and CO_2 emissions from lime and urea application,” in 2006 Intergovernmental Panel on Climate Change Guidelines for National Greenhouse Gas Inventories, Chapter 11, Vol. 4, eds C. De Klein, R. S. A. Novoa, S. Ogle, K. A. Smith, P. Rochette, and T. C. Wirth, B. G. McConkey, A. Mosier, and K. Rypdal (Hayama: IGES, Institute for Global Environmental Strategies).
Koenig, R. (2005). Eastern Washington Nutrient Management Guide. Dryland Winter Wheat. EB1987. WSU Extension Publishing and Printing.
Kollmuss, A., Lazarus, M., Lee, C., Lefranc, M., and Polycarp, C. (2010). Handbook of Carbon Offset Programs: Trading Systems. Stockholm: Funds, Protocols and Standards; Earthscan.
Lazarus, M., Lee, C., and Smith, G. (2010). “Road-testing offset protocols for landfill, manure, and afforestation/reforestation projects,” in Stockholm Environment Institute Working Paper. WP-US-0904. Version 2.1. Somerville, MA: Stockholm Environment Institute.
Lee, C. M., Lazarus, M., Smith, G. R., Todd, K., and Weitz, M. (2013). A ton is not always a ton: a road-test of landfill, manure, and afforestation/reforestation offset protocols in the U. S. carbon market. Environ. Sci. Policy 33, 53–62. doi: 10.1016/j.envsci.2013.05.002
Li, C. (2000). Modeling trace gas emissions from agricultural ecosystems. Nutr. Cycling Agroecosys. 58, 259–276. doi: 10.1023/A:1009859006242
Mahler, R. L., and Guy, S. O. (2007). Northern Idaho Fertilizer Guide. Soft White Spring Wheat. CIS 1101.
Millar, N., Robertson, G. P., Diamant, A., Gehl, R. J., Grace, P. R., and Hoben, J. P. (2012). Methodology for Quantifying Nitrous Oxide (N2O) Emissions Reductions by Reducing Nitrogen Fertilizer use on Agricultural Crops. Arkansas, KS: American Carbon Registry, Winrock International, Little Rock.
Millar, N., Robertson, G. P., Grace, P. R., Gehl, R. J., and Hoben, J. P. (2010). Nitrogen fertilizer management for nitrous oxide (N2O) mitigation in intensive corn (Maize) production: an emissions reduction protocol for US Midwest agriculture. Mitig. Adapt Strateg. Glob Change 15, 185–204. doi: 10.1007/s11027-010-9212-7
Mulla, D. J., Bhatti, A. U., Hammond, M. W., and Benson, J. A. (1992). A comparison of winter wheat yield and quality under uniform versus spatially variable fertilizer management. Agric. Ecosys. Environ. 38, 301–311. doi: 10.1016/0167-8809(92)90152-2
Painter, K. (2009). 2009 Enterprise Budgets: District 1 Wheat Rotations Under Conventional Tillage. Available online at http://web.cals.uidaho.edu/idahoagbiz/enterprise-budgets/ (Accessed 10/11/2013).
Painter, K. (2011). 2011 Enterprise Budgets: District 1 Wheat Rotations Under Conventional Tillage. Available online at http://web.cals.uidaho.edu/idahoagbiz/enterprise-budgets/ (Accessed 08/01/2013).
Painter, K. (2012). 2012 Enterprise Budgets: District 1 Wheat Rotations Under Conventional Tillage. Personal Communication.
Pan, W. L., Huggins, D. R., Malzer, G. L., Douglas, C. L. Jr., and Smith, J. L. (1997). “Field heterogeneity in soil-plant nitrogen relationships: implications for site-specific management,” in The State of Site-specific Management for Agriculture, eds F. J. Pierce and E. J. Sadlers (Madison, WI: ASA, CSSA, and SSSA), 81–99.
Pan, W. L., Schillinger, W., Huggins, D., Koenig, R., and Burns, J. (2007). Fifty years of Predicting Wheat Nitrogen Requirements in the Pacific Northwest, USA.
Papendick, R. I. (1996). Farming Systems and conservation needs in the Northwest Wheat Region. Am. J. Alt. Agric. 11, 52–57. doi: 10.1017/S0889189300006767
Rasmussen, P. E., Albrecht, S. L., and Smiley, R. W. (1998). Soil C and N changes under tillage and cropping systems in semi-arid Pacific Northwest agriculture. Soil Tillage Res. 47, 197–205. doi: 10.1016/S0167-1987(98)00106-8
Robertson, G. P., and Vitousek, P. M. (2009). Nitrogen in agriculture: balancing the cost of an essential resource. Annu. Rev. Environ. Resour. 34, 29. doi: 10.1146/annurev.environ.032108.105046
Smith, P., Martino, D., Cai, Z., and Gwary, D. (2008). Greenhouse gas mitigation in agriculture. Phil. Trans. R. Soc. B. 363, 789–813. doi: 10.1098/rstb.2007.2184
Sowers, K. E., and Miller Pan, W. L. (1994). Optimizing yield and grain protein in soft white winter wheat with split nitrogen applications. Agron. J. 86, 1020–1025. doi: 10.2134/agronj1994.00021962008600060017x
Stockle, C., Higgins, S., Kemanian, A., Nelson, R., Huggins, D., Marcos, J., et al. (2012). Carbon storage and nitrous oxide emissions of cropping systems in eastern Washington: a simulation study. J. Soil Water Conserv. 67, 365–377. doi: 10.2489/jswc.67.5.365
Taylor, S. (2016). Precision Nitrogen Management: Evaluating and Creating Management Zones Using Winter Wheat Performance. M.S. Thesis, Washington State University, Pullman, WA.
United States Environmental Protection Agency, USEPA. (2013). Inventory of U.S. Greenhouse Gas Emissions and Sinks: 1999–2011. EPA 430-R-13-001.
United States Department of Agriculture, National Agricultural Statistics Service (USDA-NASS). (2011). Quick Stats. Washington, DC. Available online at https://quickstats.nass.usda.gov/. (Accessed 1/31/2017).
Verified Carbon Standard (2013). Quantifying N2O Emissions Reductions in Agricultural Crops Through Nitrogen Fertilizer Rate Reduction. Lansing, MI: Michigan State University.
Washington Wheat Commission (2011). Washington Wheat Facts. 2011–2012. Available online at http://www.evergreen-implement.com/webres/File/2011-12WF4Web.pdf (Accessed 2/6/2017).
Vitousek, P. M., Aber, J. D., Howarth, R. W., Likens, G. E., Matson, P. A., Schindler, D. W., et al. (1997). Human alteration of the global nitrogen cycle: sources and consequences. Ecol. Appl. 7, 737–750. doi: 10.1890/1051-0761(1997)007[0737:HAOTGN]2.0.CO;2
Yorgey, G., and Kruger, C. (2015). “Nitrous oxide in the inland Pacific Northwest,” in Regional Approaches to Climate Change for Pacific Northwest Agriculture Year 4 Annual report, eds. K. Borrelli, D. Laursen, S. Eigenbrode, B. Mahler, and R. Pepper, 60–61. Available online at: https://www.reacchpna.org/sites/default/files/REACCHreportYr4.pdf
Keywords: agriculture, wheat, nitrous oxide, greenhouse gas, nitrogen, offset
Citation: Brown TT, Lee CM, Kruger CE, Reganold JP and Huggins DR (2017) Comparison of Greenhouse Gas Offset Quantification Protocols for Nitrogen Management in Dryland Wheat Cropping Systems of the Pacific Northwest. Front. Environ. Sci. 5:72. doi: 10.3389/fenvs.2017.00072
Received: 08 February 2017; Accepted: 13 October 2017;
Published: 06 November 2017.
Edited by:
Jodi Lynn Johnson-Maynard, University of Idaho, United StatesReviewed by:
Mukhtar Ahmed, Pir Mehr Ali Shah Arid Agriculture University, PakistanFernando José Cebola Lidon, Faculdade de Ciências e Tecnologia da Universidade Nova de Lisboa, Portugal
Safdar Bashir, University of Agriculture, Faisalabad, Pakistan
Copyright © 2017 Brown, Lee, Kruger, Reganold and Huggins. This is an open-access article distributed under the terms of the Creative Commons Attribution License (CC BY). The use, distribution or reproduction in other forums is permitted, provided the original author(s) or licensor are credited and that the original publication in this journal is cited, in accordance with accepted academic practice. No use, distribution or reproduction is permitted which does not comply with these terms.
*Correspondence: Tabitha T. Brown, tabitha_brown@wsu.edu