Design and Use of Representative Agricultural Pathways for Integrated Assessment of Climate Change in U.S. Pacific Northwest Cereal-Based Systems
 John M. Antle1*
  Jianhong E. Mu1 Hongliang Zhang1 Susan M. Capalbo1 Penelope L. Diebel1
  Sanford D. Eigenbrode2
  Chad E. Kruger3
  Claudio O. Stöckle4 J. D. Wulfhorst5
  John T. Abatzoglou6
- 1Department of Applied Economics, Oregon State University, Corvallis, OR, United States
- 2Department of Plant, Soil and Entomological Sciences, University of Idaho, Moscow, ID, United States
- 3Center for Sustaining Agriculture and Natural Resources, Washington State University, Mount Vernon, WA, United States
- 4Department of Biological Systems Engineering, Washington State University, Pullman, WA, United States
- 5Department of Agricultural Economics and Rural Sociology, University of Idaho, Moscow, ID, United States
- 6Department of Geography, University of Idaho, Moscow, ID, United States
This paper presents the design and use of Representative Agricultural Pathways (RAPs) in regional integrated assessment of climate impacts. In the first part of the paper, we describe the role of pathways and scenarios in regional integrated assessment as well as the three RAPs developed for a study of dryland wheat-based systems in the U.S. Pacific Northwest. We use this example to illustrate the challenges associated with the development and implementation of RAPs, including the engagement of research team and stakeholders, the dimensionality problem in integrated assessment, incorporation of economic data, and quantification of uncertainties. In the second part, we illustrate the use of RAPs in the study of climate impacts on dryland wheat-based systems. Results show that the direct impacts of future climate projections through crop yields provide the largest source of uncertainty in the climate impact and vulnerability analysis, but the indirect impacts of climate change through price projections embedded in RAPs also play an important role in the analysis. We conclude that in addition to being an essential element in designing an integrated assessment at the regional level, the RAPs development process can facilitate stakeholder engagement and improve communication of climate impact assessments.
Introduction
Future scenarios play a key role in climate impact assessments based on computer simulation. In the current research methods widely in use, these scenarios (defined as a complete characterization of the model inputs and outputs to represent a future state of the world) are constructed using “pathways” that provide narrative descriptions and quantification of variables for the disciplinary components of an integrated assessment. At the global scale, Representative Concentration Pathways (RCPs; Van Vuuren et al., 2011) and Shared Socio-economic Pathways (SSPs; O'Neill et al., 2014) are now being used to construct scenarios for simulation studies.1 In addition to its use for global integrated assessment modeling, an aim of the SSP framework is to provide the basis for more detailed sector and regional (national or sub-national) analysis. The Agricultural Model Inter-comparison and Improvement Project (AgMIP) developed the concept of Representative Agricultural Pathways (RAPs) to provide the additional agricultural detail needed to implement global and regional agricultural assessments (Rosenzweig et al., 2013; Rosenzweig and Hillel, 2015; Antle et al., 2017a). RAPs are projections of plausible future biophysical and socioeconomic conditions used to carry out climate impact assessments for agriculture (Claessens et al., 2012; Valdivia et al., 2015).
A coordinated agricultural project funded by the United States Department of Agriculture, named Regional Approaches to Climate Change—Pacific Northwest Agriculture (REACCH), was initiated in 2011 to investigate climate change impacts, adaptation, and mitigation in a contiguous region including northern Idaho, central Washington, and northern Oregon (see REACCHpna.org). The goal of the modeling team in the REACCH project was to assess climate impacts, adaptation, mitigation, and vulnerability of dryland wheat systems for the mid-twenty first century in the U.S. Pacific Northwest region. The REACCH project adopted the AgMIP methods for regional integrated assessment, including the development of RAPs (Figure 1) (Antle et al., 2015). The REACCH project utilized results from global modeling studies represented in the upper part of Figure 1 to generate projections of future prices and crop productivity to be used as inputs into the regional analysis, represented in the lower part of Figure 1.
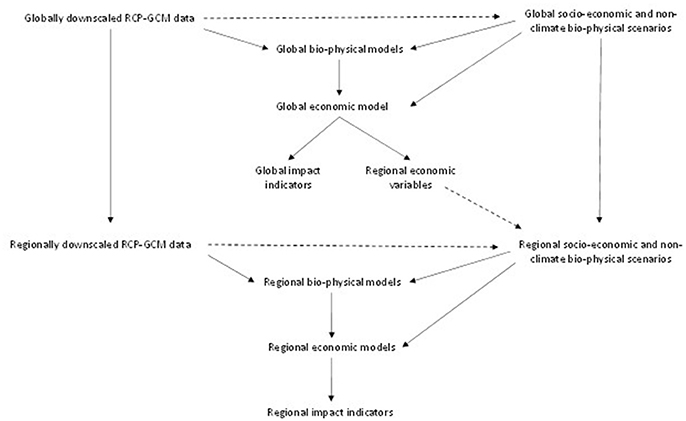
Figure 1. Global and regional integrated assessment framework as implemented by the Agricultural Model Inter-comparison and Improvement Project (AgMIP). Solid arrows show linkages consistent with global pathways design in which global socio-economic scenarios are independent of global emission concentration pathways (RCPs). Dashed arrows indicate possible linkages from RCPs to global and regional socio-economic scenarios.
To implement the regional assessments, REACCH researchers carried out climate downscaling, crop model simulations, and economic modeling. Climate data included 14 global climate models (GCMs)2 of the Coupled Model Inter-Comparison Project 5 that were evaluated for simulating credible climate characteristics across the region (Rupp et al., 2013) for two RCPs, RCP 4.5 and 8.5. The Multivariate Adaptive Constructed Analogs statistical downscaling approach was used to translate climate model outputs from their native coarse resolution to finer spatial resolution required for impact modeling (Abatzoglou and Brown, 2012)3. These data were combined with soil, crop, and management data to implement the cropping systems simulation model (CropSyst) developed at Washington State University. CropSyst was used to simulate crop yields for the principal cropping systems in the region (described further below), under projected climate conditions (Stöckle et al., 2003, 2017). Outputs from CropSyst were combined with data from the U.S. Census of Agriculture in the region, and used to parameterize an economic impact assessment model (Tradeoff Analysis Model for Multi-dimensional Impact Assessment, TOA-MD) (Antle et al., 2014). In particular, crop yields were simulated at each grid cell with a 4-km spatial resolution, and linked to individual farms through zip-code. This economic model was used to simulate economic impact, adaptation, and vulnerability of farm households to climate change under current and possible future conditions defined by climate and socio-economic scenarios.4
In implementing RAPs, the REACCH team addressed several key elements in developing and using RAPs: the process used to create RAPs, including the engagement of the research team and stakeholders; how to deal with the “dimensionality” problem (i.e., the large number of possible scenarios) that occurs in experimental designs with multi-disciplinary and multi-scale analysis; how to incorporate available economic data, including price and productivity projections from global models and regional projections of production costs, into regional scenarios; and how to quantify model and scenario uncertainties and incorporate them in the analysis and communication of results.
This article discusses how the REACCH team addressed these elements of pathway design and use, and illustrates them with climate impact and vulnerability analysis carried out in the REACCH project for wheat-based agricultural systems in the U.S. Pacific Northwest. To illustrate the development and use of RAPs we focus on climate impact and vulnerability, but note that RAPs are equally relevant to adaptation and mitigation analysis. In the next section, we discuss how the RAPs methodology described in Valdivia et al. (2015) was implemented and elaborated to address various methodological challenges in RAPs design and implementation. We then describe the RAPs developed for the REACCH project, and present results illustrating their use, including in an uncertainty analysis. In the concluding section, we reflect on implications of the analysis for further development and implementation of regional integrated assessment methods, including AgMIP's efforts to develop coordinated global and regional integrated assessments.
Materials and Methods
Design and Development of RAPs
The RAPs Design Process in the REACCH Project
Following the logical structure of RCPs and SSPs for global assessments, RAPs are intended to provide a logically consistent set of bio-physical and socio-economic drivers to be used with the climate data generated by downscaling outputs from global climate models to the regional level (Valdivia et al., 2015). When the global models used to generate data of bio-physical and socio-economic drivers as inputs to regional analysis are implemented with the RCP and SSP framework, the RAPs are logically linked to these pathways, as illustrated in Figure 1. To implement RAPs, scientists and other experts with knowledge of agricultural systems, including extension specialists and experts from the agricultural industry, work together through a step-wise process to develop narratives describing plausible future world conditions and to then construct quantitative values for model parameters. An Excel spreadsheet tool called DevRAP is used to develop and document the RAPs (Valdivia et al., 2015). The DevRAP tool includes information related to global as well as regional pathways and scenarios being developed, the time horizon of the analysis, the title, and narrative description of the pathway, and a matrix to document the assumed direction and magnitude of changes in variables and the rationale for those changes. Elements of RAPs can include any factor considered relevant by the research team and stakeholders, but typically include bio-physical, institutional, policy, socio-economic, and technological factors.
The first part of the process is to define the basic elements of the analysis, including the time horizon, the number of RAPs, and linkages to global pathways and scenarios. Following the AgMIP regional integrated assessment method, the REACCH project selected a set of global socio-economic pathways that were used by global modeling teams, and linked their regional RAPs and economic data to these global pathways. The REACCH project utilized prices and crop productivity trends from global models, together with regional projections of production costs (discussed below) as inputs for the regional economic analysis. In the study below we chose the time horizon of medium future, i.e., 2050, because prices and crop productivity trends from global models are only available in 2050. More importantly, stakeholders, especially farmers, show great interests in the next 30 years, rather than distant future.
The second part of the process involves the identification of the specific variables to be included in the RAPs, and a process for quantification of their changes over the time horizon of the analysis. AgMIP devised a series of steps for this purpose involving members of the research team, and possibly other experts and stakeholders who have expertise relevant to the variables included in the RAPs. Within the REACCH project, a team of researchers was identified with expertise in the relevant disciplines required for a comprehensive RAP assessment. The team first met for an all-day workshop to learn about the RAPs concepts and process, and started with a “Business as Usual” RAP and a short narrative description consistent with the global pathways that had been identified. The team members identified key parameters and drafted short narratives for them. Team members were assigned variables for further research and quantification using a template for documentation. At a second meeting, team members reported findings and discussed storylines for each variable and reached consensus on quantification, including direction, relative magnitude, and the percent change, a short narrative explaining the rationale for the change, references to literature used, and an assessment of confidence in the quantitative values. The team also reviewed variables for internal consistency. Next, additional RAPs were identified, and the development process was repeated. The RAPs were presented to the entire research project team and stakeholders at project meetings and through reports. The RAPs were revised based on feedback from these meetings and reports.
REACCH RAP Narratives
The REACCH RAPs development team evaluated the number of RAPs that would be feasible to use in the modeling studies and concluded that three would be adequate to capture the range of plausible conditions relevant to the wheat systems in the Pacific Northwest region. In addition to the Business as Usual case, the team identified a relatively optimistic Sustainable Development pathway and a more pessimistic Dysfunctional World pathway.
RAP 1: Sustainable development
This RAP is linked to SSP1 (Sustainable Development). Under this pathway, rural development continues with moderate increases in population in regional centers, with larger and more diversified regional economies having a positive impact on community and social well-being. Traditional commodity subsidies are replaced by a carbon tax and an expansion of conservation and environmental programs, which slow the consolidation of land into larger farms and support some expansion of mid- and small-scale farms. Recent trends in mechanical, chemical, and biological technology continue, but in response to the carbon tax, there is more innovation in technology that helps reduce fossil fuel intensity. Global commodity prices rise moderately along with the increases in fossil fuel prices due to the carbon tax.
RAP 2: Business as usual
This RAP is linked to SSP2 (Middle of the Road) and SSP5 (Conventional Development). Under this pathway, rural development continues with moderate increases in population in regional centers, larger, and more diversified regional economies, and trends toward mechanical, chemical, and biological technology continue. Trends toward environmental regulation to protect air and water quality continue, but fiscal pressures lead to real reductions in traditional commodity subsidies and other agriculture-specific conservation programs making conservation more individualized. Agricultural prices increase in real terms due to continued growth in demand, especially for feed grains and for politically mandated production of biofuels. Some rural farm-based communities continue to sustain infrastructure and social cohesion, while others continue to experience net out-migration.
RAP 3: Dysfunctional world
This RAP is linked to SSP3 (Fragmented World) and SSP4 (Inequality World). Under this pathway, an unbalanced rural development occurs, with the continued loss of “agriculture in the middle” and consolidation of most commodity production into large corporate entities with contract arrangements for farm management and related impacts on rural farm-based communities. Suburban development continues largely unregulated in peri-urban areas and rural areas. Traditional farm subsidy programs are largely eliminated, and conservation and environmental programs are limited due to budget constraints. Advances in large-scale mechanical, chemical, and biological technology continue, but disruptions to global agricultural research and development and agricultural trade result in substantially higher and volatile agricultural commodity prices.
Our pathway narrative descriptions are consistent with global RAPs. In both RAP 1 (sustainable development) and RAP 2 (business as usual), trends toward environmental regulation continue, with a major difference in carbon tax.
RAP Variables, Trends, and Ranges
Each RAP includes a set of variables to represent plausible future bio-physical, institutional, policy, socio-economic, and technological conditions. The focus is on variables in the simulation models that will be used, but the RAPs can also include other variables to provide context for interpretation of results. As shown in Table 1, likely trends are drawn for each key variable under each RAP based on global or regional economic model projections, historical data and/or experts' opinions. In Table 1, rising arrows indicate increasing trends and falling arrows indicate declining trends. Angles of arrows represent magnitudes of relative changes. Table 2 shows the range of each trend. The crop simulation and economic modeling teams use these trends to assign values to model parameters. The range of each trend was used to design sensitivity and uncertainty analysis.
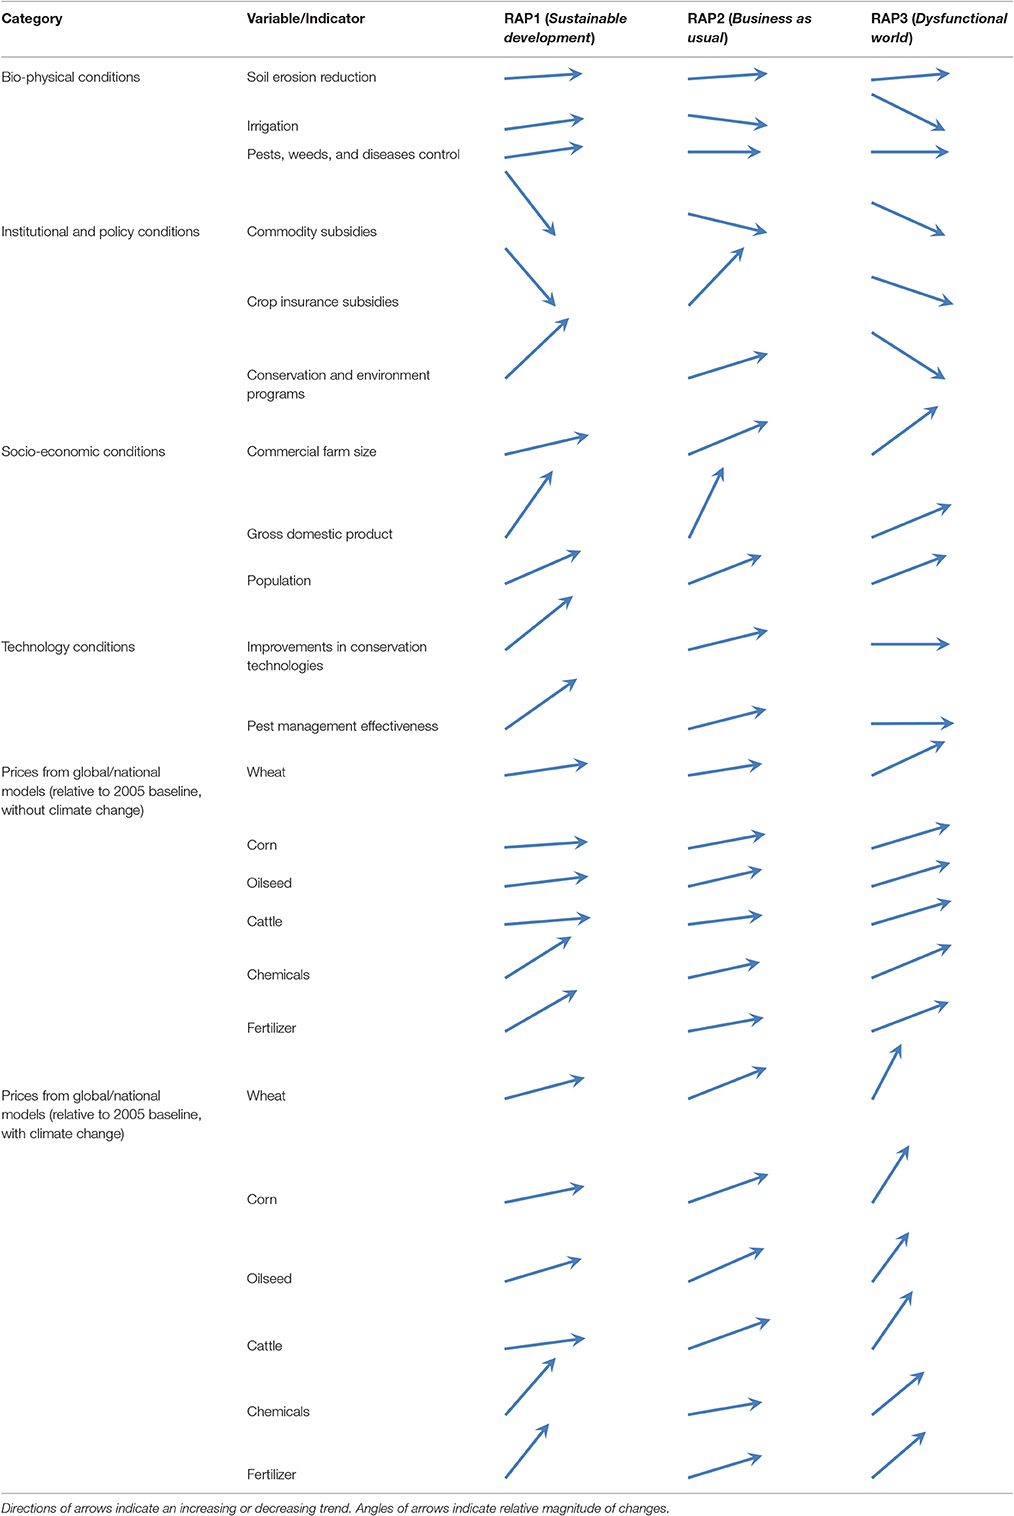
Table 1. Likely trends of variables for REACCH RAPs.
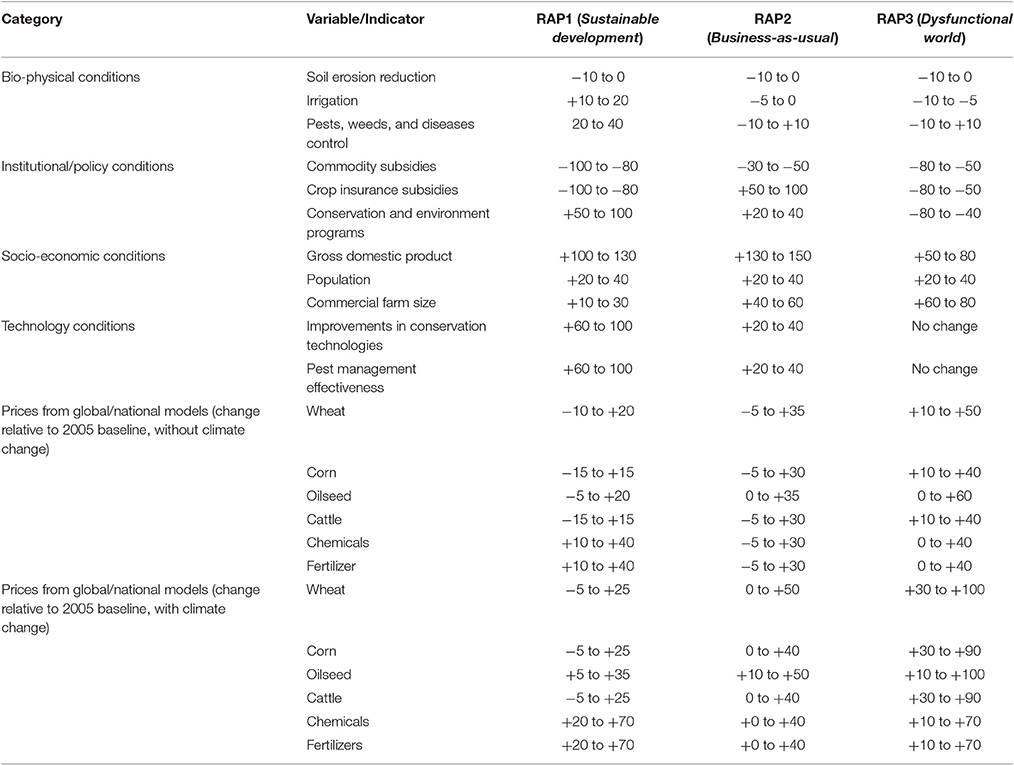
Table 2. Ranges of variable changes for REACH RAPs (%).
There are both similarities and differences between the variables in each RAP. Generally, likely trends for key variables in RAP3 differ in direction and magnitude from those in RAP1 and RAP2, while likely trends of key variables in RAP1 and RAP2 have similar direction but differ in magnitude. A key difference between RAP3 and the other two is the assumption of trade barriers and disruptions to global agricultural research and development, limiting production, and leading to higher commodity prices projected by global economic models in RAP3. It is also notable that all three RAPs have commodity subsidies decreasing, but the rationales differ according to the RAP narratives. In RAP1, commodity subsidies decrease because they are replaced by conservation subsidies, whereas in RAP3 commodity subsidies decrease due to overall reduction in public support.
Incorporating Output Price and Production Cost Projections
In collaboration with AgMIP and the Inter-sectoral Impact Model Inter-comparison Project, a group of 9 major modeling teams completed the first global agricultural economic model inter-comparison of climate change impacts in which all of the models used a standard set of scenarios linked to one emissions scenario and two socio-economic scenarios (Nelson et al., 2014; von Lampe et al., 2014). These scenarios did not embody effects of increasing carbon dioxide concentrations on crop yields so in this sense they can be viewed as relatively pessimistic. However, these scenarios did incorporate a relatively optimistic set of projected crop yield growth rates to represent the impacts of ongoing productivity improvements, ranging from 1 to 2.5 percent annually for major crops (wheat, coarse grains, rice, sugar, and oilseed) across the major regions of the world (von Lampe et al., 2014), so in this respect the scenarios can be viewed as somewhat optimistic.
These global economic model projections show that, without climate change, price changes to 2050 could range from −30 to +40 percent relative to 2005 baseline values, due to factors such as income growth, population growth, and increases in agricultural productivity. In contrast, the effects of climate change on prices in 2050, all else held constant, range from 0 to 60 percent increases relative to 2005 baseline values. Thus, combining the economic model uncertainty and climate uncertainty, there is a wide range of uncertainty in future price projections. We know that historically, agricultural commodity prices have declined in “real” terms for the past century or more, reflecting the fact that global agricultural production has increased at a faster rate than global demand, despite population growth (USDA, 2016). A major question for the twenty-first century is whether this long-term trend in prices is being reversed by the combined effects of demand growth, environmental degradation, reductions in productivity growth, and climate change. These model projections show that the continuation of this trend is very uncertain, but it is also not apparent that there will be substantially higher prices—the result will depend on the relative importance of factors shifting supply and demand.
Projected crop yields are generally lower in most parts of the world in response to climate change, particularly in the latter half of this century, in the tropics, and under high emissions scenarios (Porter et al., 2014). The 9 global economic models in the AgMIP inter-comparison study show lower yields on average, ranging from –40 to +10 percent in yield changes averaged across major commodities. Most models project some increases in land area under production, but little impact on trade or consumption.
As discussed above, socio-economic variables in RAPs such as population, gross domestic product (GDP), commodity prices, and input prices can be derived from the global economic models or from extrapolations of historical price trends. All of the economic models discussed above project prices for wheat and oilseed crops with or without climate change for the U.S. (Nelson et al., 2014). Since the wheat and oilseed markets are global and the REACCH region produces and exports these crops, the global prices will largely determine prices received by farmers in this region. Some production input prices (e.g., cost of diesel fuels and fertilizers) are also determined to a large degree by global fossil fuel prices, but other input prices such as electricity and labor wages are region-specific and can be estimated based on historical trends and other factors, such as national policy, incorporated in the RAPs.
To represent plausible future trends of input and output prices for the REACCH region, we observe that farm net returns are calculated as the difference between revenue and cost. For farms to earn a positive real rate of return, this difference must be positive, or the ratio of cost to revenue must be less than one. Following this idea, we use the assumption of a stable long-term relationship between revenue and cost to project future cost by projecting the cost-over-revenue ratio (CRR), which is defined as the ratio of production costs over production sales.5 The CRR is useful because it allows us to predict the future production costs using the future revenues that are predicted by the global and regional economic models. Using historical county-level panel data, we estimate an econometric model of CRR and use it to predict future values. Variables used in the CRR model include crop yields and price indexes for livestock products, crops, energy, fertilizer, and chemicals.
To address the dimensionality problem caused by the combination of a large number of scenario elements, we assume three plausible future input and output prices under each RAP: low, “L,” medium, “M,” and high “H” input and output prices. Each RAP has output price projections with or without climate change from global and regional economic models, giving a total of 18 scenarios. Table 3 shows details of the three price scenarios and the CRR under each RAP. All of the estimates for potential yields, prices, costs, and predicted CRR were also used to parameterize the regional economic simulation model.
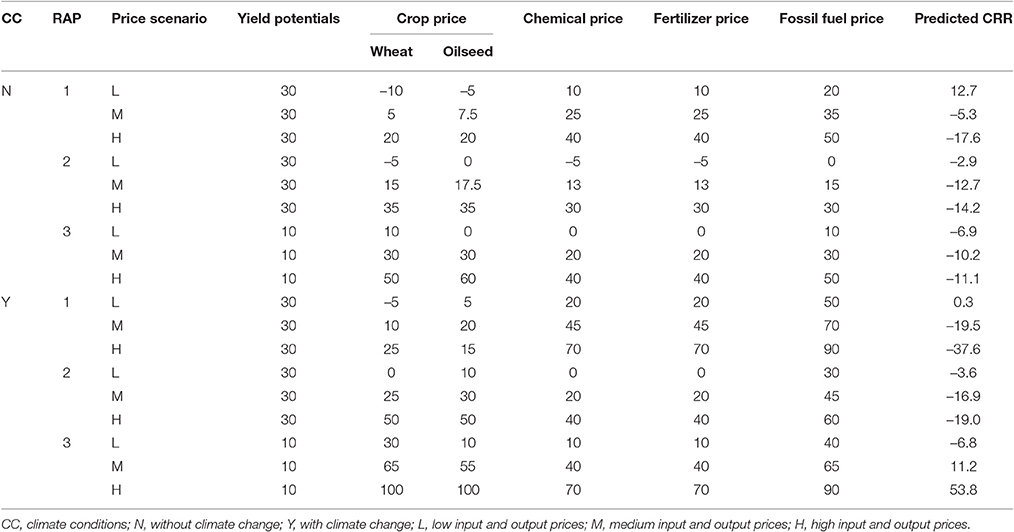
Table 3. Assumptions of changes in yield potentials and input and output prices for cost-over-revenue ratio (CRR) prediction and economic impact simulation (%).
Stakeholders Engagement
A stakeholder advisory committee (38 members) was formed since the initial of the REACCH project. Relevant stakeholders were identified and invited to join the stakeholder advisory committee, which includes representatives of growers, agricultural industry, commodities, citizen groups as well as state and federal agencies. The REACCH project prioritized engaging stakeholders to integrate local and scientific knowledge in research, education, and extension. The level of engagement and associated participatory approach and method were dependent on specific research teams and objectives within the REACCH project.
The RAPs team engaged stakeholders in the design process after the preliminary business-as-usual RAP short narrative description was formed. Stakeholders in the advisory committee participated in the designing process of the RAPs through workshops held by the RAPs team at annual project meetings. There are three major steps in engaging stakeholders. First, the RAPs team trained stakeholders with researchers and other experts on the concepts and process. Second, the RAPs team divided all participants including stakeholders into small groups and facilitated their discussion on additional RAPs and scenarios and elements that should be included in the business-as-usual RAP. In the REACCH project, the stakeholder advisory committee was only formally consulted after the initial RAPs development had been completed. Third, the RAPs team presented the finalized RAPs to stakeholders at project meetings and through reports. The REACCH project held six annual project meetings, which enabled the RAPs team to engage stakeholders in this three-step approach.
This process of stakeholder engagement was used due to the features of the REACCH project, including a stakeholder advisory committee and several project meetings. Also, within the REACCH project, two survey teams collected social and economic information on farmers. The team member could already have interactions with farmers based on their research for the REACCH project. In addition, the majority of the design and implementation of RAPs involves quantifying parameters in the future, so researchers rather than stakeholders are appropriate to be fully engaged in the process. It would be more useful to fully engage stakeholders in the process when considering the implementation of adaptation strategies.
Issues and Challenges in RAP Development
The REACCH modeling team identified several practical and methodological challenges in designing and implementing RAPs, including training participants, engaging stakeholders, and linking global and regional pathways and scenarios.
Training Participants
A first challenge is to train all of the participants, including research team members, outside experts, and stakeholders, about the scenario design framework and the RAPs methodology. Research team members as well as outside experts and stakeholders often find it difficult to quantify key variables and may feel that values used are subjective. For example, government policies on crop insurance and conservation vary periodically and have effects on federal subsidies, and conservation technology to protect the environment depends on future technology innovation with substantial uncertainty. Also, the RAPs can contain many elements that do not enter into the models being used. This raises several issues. One is that researchers and stakeholders may expend substantial time on features that are not used in the modeling (e.g., variables included in Tables 1, 2 but not in Table 3), and some of the REACCH stakeholders questioned the usefulness of developing elements that could not be quantified in the models, even though they were justified by the research team as providing context to interpret model results. To address these issues, the developers and facilitators of RAPs development explained that the goal is to produce a consistent plausible future, not a prediction of the future. It is important for the participants to understand the overall assessment framework (Figure 1) and the role of pathways and scenarios in the experimental design aspect of simulation modeling. As for elements representing aspects of a future world that stakeholders consider and are relevant to research questions, we need to include additional researchers and experts with knowledge of these specific questions of interest and capacities to quantify parameters used for modeling. This may involve additional literature review, survey of expert opinions, collection of data, and improvement of existing models.
Engaging Stakeholders
A second challenge in RAPs development is when and how to engage stakeholders. Engaging stakeholders is now widely promoted in research community and has partly been driven by increasing demand from decision-makers in the private and public sectors for an action-oriented interdisciplinary approach to solving complex economic, environmental, and social issues. A growing body of literature in engaging stakeholders focuses on how to improve the performance of stakeholder engagement and prescribed best practices to engage them (see a detailed review by Reed, 2008). While it is recommended to participate as early as possible, however, the time of participation is dependent on the objective, knowledge, and skills of researchers as well as capacities of stakeholders.
In the REACCH project, the stakeholder advisory committee was only formally consulted after the initial RAPs development had been completed. In contrast, some AgMIP teams incorporated stakeholders from the beginning of the process (Valdivia et al., 2015). It is not yet clear whether either of these approaches performs better. An AgMIP team in Southern Africa used a process similar to REACCH that did not include stakeholders in the initial RAPs development. In that case, the stakeholders found the RAPs to be too conservative, and encouraged the research team to develop new RAPs with more aggressive assumptions about possible technological and policy changes. For the REACCH project, however, this approach proved to be effective, in part because stakeholders participated in a project meeting where the preliminary RAPs were presented and recommendations from the project team members and stakeholders could be incorporated. Also, the role of stakeholders engagement depends on specific research, knowledge of research team, and capabilities of stakeholders. The design and development of RAPs requires scientific knowledge of modeling agricultural systems; thus, our approach of engaging stakeholders is appropriate for the study region to design and implement the RAPs and performs better for scientists rather than stakeholders to improve knowledge on climate change impacts. If it is action related, e.g., implementing adaptations to reduce negative or increase positive impacts from climate change, additional stakeholder engagement would be appropriate.
RAP Scope and Differentiation
A related issue that was identified through stakeholder engagement is the appropriate scope of RAPs. There is a tendency among stakeholder participants to feel the need to address many aspects of a future world that they may consider relevant, but these aspects may not correspond to the variables in the models being used. An example that arose in the context of the REACCH project is the type of contractual arrangements used between producers and grain marketing intermediaries. While this consideration is relevant in actual farm operations, there are no data available to allow this level of financial detail to be incorporated into the simulation analyses that were carried out by the project. In this type of situation, the result can be the use of a large amount of time discussing variables that are not used in models.
Another related issue is how different the RAPs are in terms of key variables impacting the analysis. As we will see in the discussion below, the quantitative analysis shows a similarity between RAP1 and RAP2 which reflects the range of feasible expectations held by the research team. For a number of variables, similar trends in the “Business as Usual” and “Sustainable Development” world were considered plausible. As noted above, one of the AgMIP teams developed RAPs that were considered by their stakeholders to be too similar to current world conditions. One of the qualitative judgments that RAPs developers must make is how distinct “plausible” scenarios can be from “expected” or “Business as Usual” scenarios. Many scenario design experts encourage researchers to consider future scenarios that are “wildcard” or that contain substantial “surprises” not considered likely under current conditions. But it has to be acknowledged that there is no “scientific” basis for such assumptions—there will always be a subjective element in the “art” in pathway and scenario development.
Linking Global and Regional Pathways and Scenarios
A third methodological challenge is to link global and regional pathways and scenarios, an important element in the design illustrated in Figure 1. Figure 1 shows that the regional RAPs are linked to and depend on outputs from global models that in turn depend on global emissions pathways (i.e., RCPs) and global socio-economic pathways (i.e., SSPs). The REACCH team encountered several methodological issues in making these linkages, as discussed below in more detail. Two aspects of the linkage from global to regional pathways and scenarios were addressed in the REACCH project, building on the AgMIP methods discussed in Valdivia et al. (2015).
A first aspect of linkage is to do so consistently across global and regional scales. SSPs are intended to represent elements of the future that are not climate-dependent, thus allowing them to be combined with more than one RCP in the design of global integrated assessment scenarios in a “matrix” that represents the possible combinations of RCPs and SSPs (O'Neill et al., 2014). Thus, as Figure 1 shows, the RCPs are inputs into global climate models, but do not directly affect elements of SSPs (as indicated by the solid arrows in Figure 1). However, this “matrix” design does not work logically for some elements of management that enter into bio-physical models (e.g., water management) and that cannot be defined independently of climate (represented in Figure 1 by the dashed line from RCPs to global socio-economic scenarios). In addition, agricultural commodity prices are outcomes from global economic models and are also inputs or drivers on the regional or local scale (Figure 1). Thus, at the regional scale a RAP that includes global prices from a particular global economic model run is necessarily linked to the particular combination of RCP and SSP that was used to generate the global analysis.
The second aspect of linkage concerns the uncertainty associated with global models, including AgMIP global economic modeling and price uncertainty and methods to incorporate price uncertainty into regional RAPs. Figure 1 and Tables 1, 2 show that prices from global economic models are important components of regional RAPs. Tables 1, 2 also show that these values span a wide range. In principle, this model uncertainty could be incorporated through Monte Carlo simulation, but distributions for most parameters are unknown and there are too many parameters to make this approach practicable. Therefore, as we discuss in the next section, a simpler sensitivity analysis approach is taken in which selected key parameters are varied, although the number of parameters still creates dimensionality challenges.
Wheat-Based Systems in the REACCH Study Region
Winter wheat is a major crop in the Pacific Northwest region, occupying 3.11 million acres as of 2014 (USDA, 2015). Most of this crop is grown across the Columbia Plateau between the Cascades and Northern Rocky Mountains. Using data from the U.S. Census of Agriculture and the National Land Cover Database, we characterized three rain-fed cereal-cropping systems in the region that are the focus of this study presented here, based on Huggins et al. (2015): the annual rotation of winter wheat and spring wheat with summer crops (WWA); the winter wheat-fallow system (WWF); and the transitional wheat system (WWT) that combines winter and spring wheat in a fallow rotation. In the eastern region with an average of 580 mm precipitation per year, farms use the WWA system in which winter wheat is rotated with spring wheat and summer crops over a 3–4 year cycle and fallow is typically not used. In areas with lower rainfall, farmers use the WWT system that includes winter and spring wheat in a 3-year rotation with fallow every third year. In the lowest rainfall areas (average 310 mm), the WWF system is used with winter wheat grown every other year with fallow used to restore soil moisture.
Table 4 summarizes the socio-economic characteristics of small (below the median cropped acres) and large (above the median cropped acres) farms within each dryland system using 2007 Census of Agriculture data. The census data were used in the analysis because they provide detailed information about virtually every farm in the region, and thus provide the best available data to characterize the farm population in terms of yields and economic variables that are the foundation of the economic modeling approach described below. The data show that WWF farms are the largest and have the lowest yields, but yields are similar between small and large farms of each system. The data also show that large commercial WWA farm sales of wheat are about 78 percent of total crop sales, whereas the WWF earn almost all of their income from wheat production and WWT farms are somewhat less specialized. These yields and sales data are the basis for the economic analysis reported below.
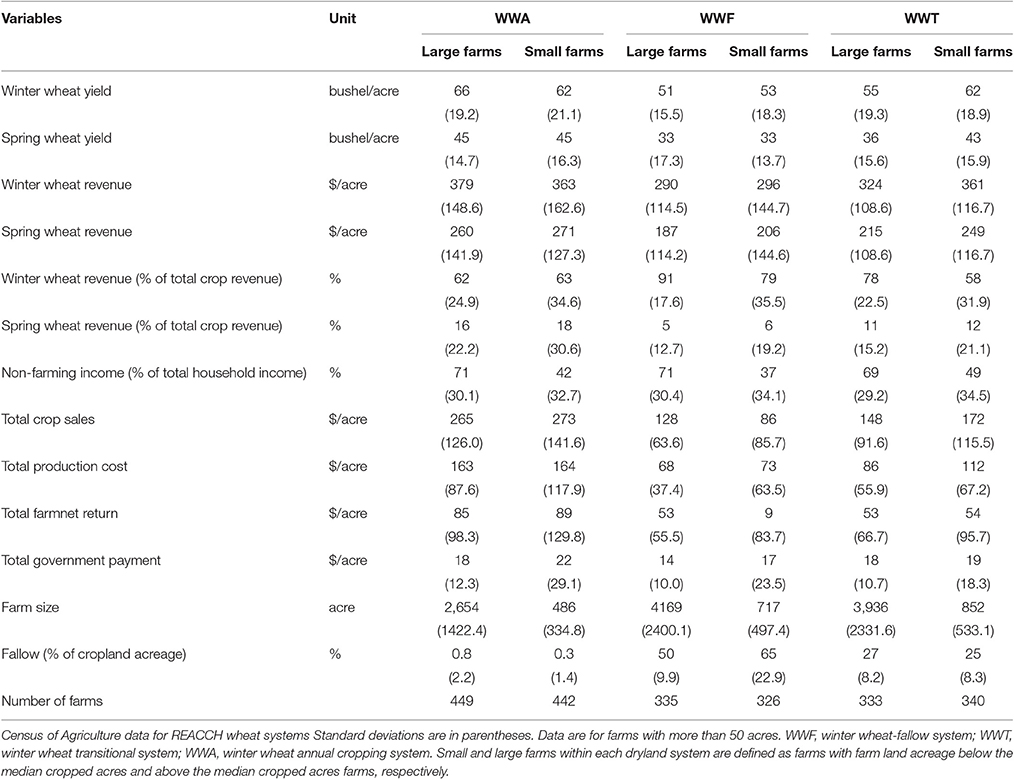
Table 4. Summary statistics from 2007 U.S.
Results and Discussion: Using RAPs in the REACCH Project
In this section, we illustrate the use of RAPs in regional integrated assessment as implemented in the REACCH project. The study incorporated RAPs into climate impact analysis to investigate the impacts of climate change on current production systems under current socio-economic conditions relative to the current no-climate baseline, as well as impacts of climate change on future production systems under future socio-economic conditions related to the future no-climate baseline. In addition, the REACCH analysis investigated the contribution of each source of uncertainty in the climate impact assessment.
Impacts of Climate Change on Dryland Wheat-Based Systems
Here we present results using climate projections based on RCP 4.5 for the 14 global climate models used in this study. Figure 2 shows the distributions of changes in simulated crop yields for winter wheat, spring wheat and spring peas, averaged over the study region for each of the 14 climate model projections for 2050 relative to baseline values from 1981 to 2010. Despite these differences across climate models and locations, the average yield changes are generally positive for wheat, but are negative in some cases for spring peas. These results reflect the fact that the climate models generally project warmer and wetter winters, but hotter and drier summer weather. The wheat and pea yield changes also incorporate the effects of higher CO2 concentrations that are predicted to have a positive effect on yields according to the CropSyst model.
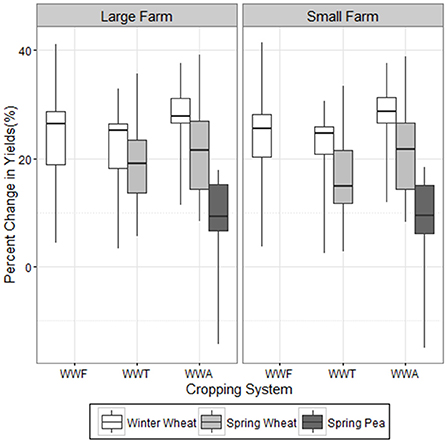
Figure 2. Percent change in simulated yields in 2050 due to climate change, averaged over the REACCH study area, based on downscaled CMIP5 data from 14 global climate models under RCP 4.5. WWF, winter wheat-fallow system; WWT, winter wheat transitional system; WWA, winter wheat annual cropping system.
For each climate model projection, yields are simulated at each gridded cell and linked to individual farms through zip codes.6 Figure 3 shows one of the resulting distributions of simulated relative yields for one climate projection, where the variation is across gridded cells. A relative yield is defined as the average simulated yield under future climate at a site divided by the average simulated yield under current climate at the same site (thus a relative yield of 1 indicates no yield change due to climate change).7 This figure demonstrates that there is substantial heterogeneity in projected yield changes across farms in the region, with yield increases at many locations (relative yield greater than 1), but with yield decreases at some locations (relative yield less than 1) due to spatial variation in projected weather patterns.
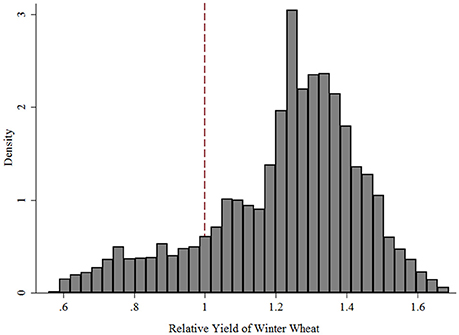
Figure 3. Distribution of simulated relative yields of winter wheat for large farms in the REACCH study area using the annual cropping system in 2050, based on downscaled CMIP5 data from one global climate model and RCP4.5. Relative yield is defined as the yield simulated with future climate divided by the yield simulated with current climate at the same site for the same crop species.
Table 5 presents results from the economic impact analysis. These results are impacts of climate change using the current cropping systems without adaptations such as changes in crop varieties, fertilizer application rates, or types of crops. The economic model TOA-MD utilizes the simulated relative yields, together with the agricultural census data in Table 4 to define current economic conditions, and the RAPs data to define future economic conditions, to simulate economic impacts of climate change. Each scenario represents the combined effects of a particular global climate model output to project future prices, and a socio-economic scenario which includes projected changes in production costs, changes in policy (i.e., crop and conservation subsidies) and other parameters in the TOA-MD model. Seven measures of economic impact were simulated: vulnerability to loss (percent of farms that could experience a loss in farm income); total average gains, total average losses, and total average net gains in farm returns; total average gains, total average losses, and total average net gains in household income (which includes both farm and non-farm income).
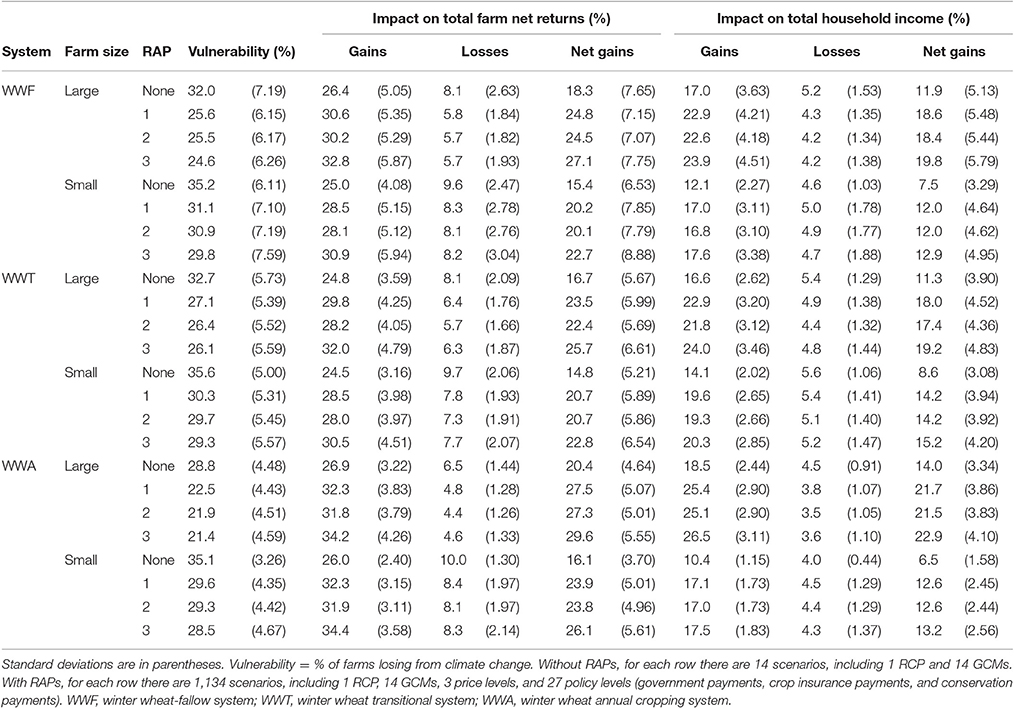
Table 5. Climate change impacts in 2050 without adaptation, REACCH study region.
Table 5 shows that the average economic impact of climate change on current production systems under current conditions (indicated in the table as “No RAP”) is positive, consistent with the crop model simulations that show a positive impact on crop productivity, on average (Figure 2). However, due to the fact that there are some individual farms projected to experience higher yields, and some farms projected to have negative yield changes (as illustrated in Figure 3), the economic analysis show that on average about one-third of farms are vulnerable to economic losses from climate change (indicated as percent vulnerable in the table). These figures also show that small farms tend to be more vulnerable to loss than large farms under current world, presumably due to their different locations and economic conditions. The analysis also shows that impacts on small farms are less as a percentage of household income, due to the fact that small farms earn more of their income from non-farm sources.
Table 5 shows that when the analysis is carried out under the three RAPs, the impacts of climate change tend to be more positive, due to the fact that crop prices are projected to be higher in the future with climate change. Crop prices are the highest for RAP 3 which also shows the most positive impacts. However, it should be noted that the differences between the three RAPs is relatively small. This is due to two factors. First, as Table 3 shows, the production cost is projected to be higher as crop prices and input prices increase, and the RAPs also embody the assumption that both output and input prices will increase in the future with climate change. Second, the other variables in the RAPs that affect economic returns, government subsidy payments, are assumed not to change with climate change. As a result, as the analysis presented in the next section will show more clearly, the interactions between climate and biophysical and socioeconomic factors in this analysis play a relatively small role in determining the outcomes.
Table 5 also shows some important differences in impact across the three cropping systems, with the WWF system generally showing higher vulnerability to climate change, with some notable differences across farm sizes. It is important to keep in mind that the WWF system is used in the driest area in the study region. Finally, we observe that the impacts measured relative to household income are generally smaller than when measured relative to farm income which is a component of household income. We emphasize here that our analysis focuses on climate change impacts without adaptation or mitigation. If adaptation or mitigation were included, farm household income would be likely to increase due to gains from adaptation and compensation for provision of mitigation services.
Quantifying Sources of Uncertainty
Uncertainty is associated with each component of integrated assessment, including the climate model projections of changes in temperature and precipitation, price projections from global economic models, crop model simulations, the regional economic impact assessment model, and the socio-economic conditions defined in the RAPs. In the REACCH study it was not feasible to utilize more than one crop model and one regional economic impact model, so the uncertainty analysis was constructed with respect to climate projections, global economic model projections of prices, regional projections of production costs, and other elements of the RAPs. For each uncertainty source, the variance-decomposition approach in Wallach et al. (2015) was used to construct the share of total variation associated with each factor as Si = , where Si is the contribution of the i th source of uncertainty (i.e., percent of total variation), Y is an outcome variable, Xi is the i th source of uncertainty, E(·) is the expectation operator, and Var(·) is the total variance.8
Using this approach, the contribution of each uncertainty source to the variation in climate change impacts was quantified by using the first-order sensitivity coefficient to measure the share of total variation of outcome variables from 14 climate models through their direct impacts on crop yields, three RAPs, and the indirect impacts of climate change through three levels of future prices and associated production costs. Thus, in this analysis, we separate the effects of climate on future prices and production costs from the other variables contained in the RAPs.
Table 6 shows that the direct impacts of future climate projections through crop yields provide the largest source of uncertainty in the climate impact and vulnerability analysis, but the indirect impacts of climate change through price projections also play an important role in the analysis. Importantly, the analysis shows that the relative importance of direct climate impacts on yields varies substantially with the type of system. The results show that the WWA system outcomes are generally more sensitive to price changes in relative terms. The contribution of the RAPs, apart from price effects, is very small. These results demonstrate that both global climate and global economic model uncertainty may dominate the effects of other socio-ecomic variables contained in the RAPs. However, it is important to recognize that uncertainty in the crop model and the regional economic impact model are not incorporated here, and could also represent an important source of uncertainty.
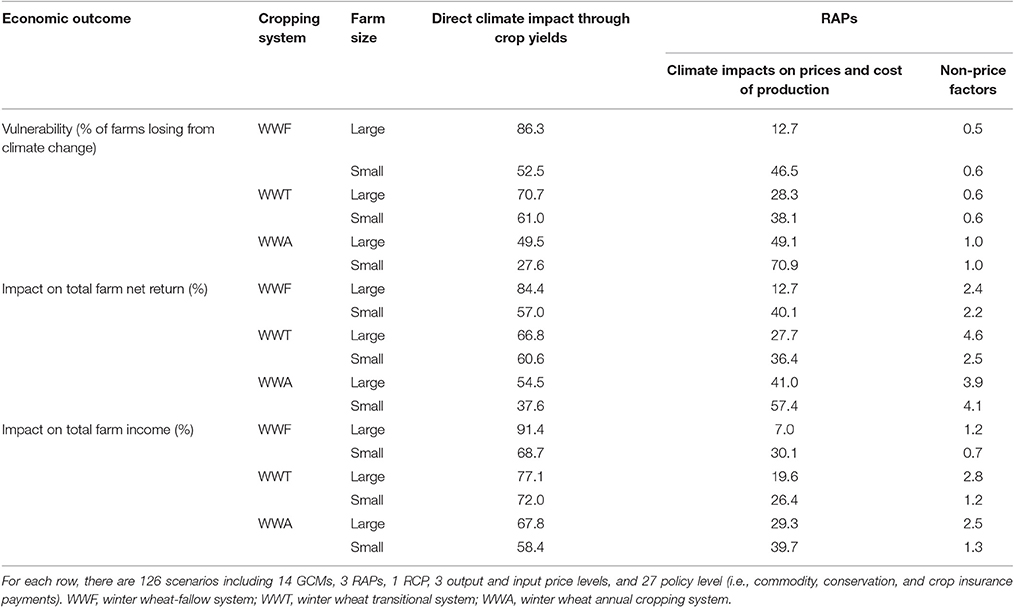
Table 6. Decomposition of sources of uncertainty in climate vulnerability and impact (%).
Strengths and Limitations
The experience with the RAPs for the REACCH project demonstrated the value of pathway and scenario development to the creation of a trans-disciplinary research effort, by facilitating communication within the research team and between the research team and stakeholders. As we discussed in this paper, RAPs implementation poses a number of challenges, including the engagement of research team and stakeholders, the dimensionality problem in integrated assessment, incorporation of economic data and quantification of uncertainties. Further systematic research on pathway and scenario development will be needed to evaluate alternative methods to address these challenges.
While systematic development of pathways and scenarios is essential for climate impact research, it is essential to recognize the limitations and areas for further improvement in methods. First, the design and implementation of RAPs assumes that both input and output prices will move in the same direction regardless of climate change. As a result, the projected cost of production offsets the effect of climate change on revenues and reduces the differences between the dysfunctional world pathway and the other two. Second, some variables in the RAPs that affect economic returns are assumed unaffected by climate change, e.g., government subsidy payments. Moreover, a lack of climate-related conservation policies in the RAPs diminishes the difference between sustainable development and business-as-usual pathways. Third, some important elements in the RAPs are not included in our analysis, e.g., crop pests and diseases. This is due to the fact that existing crop simulation models are incapable to handle these elements. Our analysis can include these elements in the future when crop simulation models are improved, and thus increase the accuracy of assessment results.
Conclusions
This paper presents the design and use of RAPs to construct plausible future agriculture-related pathways and scenarios for regional integrated assessment (RIA) of climate change impacts. We describe how the REACCH team uses the AgMIP RIA methodology to design three regional RAPs and discusses challenges associated with RAPs development and implementation, including the engagement of research team and stakeholders, the dimensionality problem in integrated assessment, incorporation of economic data, and quantification of uncertainties. We illustrate the use of the three RAPs in a study of climate change impacts on dryland wheat-based systems in the U.S. Pacific Northwest region.
We find that under future socio-economic conditions characterized in RAPs the average economic impact of climate change without adaptation is more positive than no RAP scenarios, although the differences between the three RAPs are relatively small. Results show some important differences in impact across the three cropping systems, with the winter wheat-fallow system generally showing higher vulnerability to climate change compared to the annually cropped system. These findings imply that without accounting for changes in socio-economic conditions represented in RAPs, the economic impact of climate change on dryland wheat-based production systems would be over-estimated in the study region. The economic analysis also shows heterogeneous climate impacts among wheat farms due to the fact that, with climate change, some farms are likely to gain whereas other are vulnerable to loss.
To further evaluate the relative importance of climate modeling uncertainty and RAPs uncertainty, we evaluated the contributions of uncertainty sources to the variation in climate change impacts. Results show that the direct impacts of future climate projections through crop yields provide the largest source of uncertainty in the climate impact and vulnerability analysis, but the indirect impacts of climate change through price projections embedded in RAPs also play an important role in the analysis. These results demonstrate that the use of RAPs is an essential element in an integrated assessment of climate change impacts at the regional level.
Finally, we emphasize the critical role that a transparent, protocol-based approach to pathway and scenario development plays in improving the science base for integrated assessment. A protocol-based approach is needed to facilitate the ongoing improvement of climate impact assessment through coordinated global and regional assessments (Rosenzweig et al., 2013; Antle et al., 2017a).
Author Contributions
JA: Led research team, lead contribution to design, and implementation of research, conceived and drafted paper, led revisions. JM and HZ: assisted design of research, contributed to research implementation, drafted some sections of paper, assisted in revisions. SC: assisted design of research, contributed to research implementation, assisted in revisions. PD, SE, CK, CS, JD, and JAb: contributed to research implementation, assisted in revisions.
Conflict of Interest Statement
The authors declare that the research was conducted in the absence of any commercial or financial relationships that could be construed as a potential conflict of interest.
Acknowledgments
This research was supported by USDA-NIFA award #2011-68002-30191.
Abbreviations
AgMIP, Agricultural Model Inter-comparison and Improvement Project; GCM, Global Climate Model; RAP, Representative Agricultural Pathway; RCP, Representative Concentration Pathway; SSP, Shared Socio-economic Pathway; REACCH, Regional Approaches to Climate Change – Pacific Northwest Agriculture; RIA, Regional Integrated Assessment; TOA-MD, Tradeoff Analysis Model for Multi-dimensional Impact Assessment; WWA, Annual Rotation of Winter Wheat and Spring Wheat with Summer Crops; WWF, Winter Wheat-fallow System; WWT, Transitional Wheat System.
Footnotes
1. ^The Representative Concentration Pathways (RCPs) describe four possible climate futures using radiative forcing values in the year 2100 relative to pre-industrial values, depending on how much greenhouse gases are emitted in the future. These values are used to initiate climate model simulations. The Shared Socioeconomic Pathways (SSPs) describe five possible socio-economic futures using a set of variables describing socio-economic conditions, including demographic and economic trends. The RCPs and SSPs are used together in integrated assessments of future climate impact, vulnerability, adaptation, and mitigation.
2. ^The names of these 14 global climate models are bcc-csm1-1, BNU-ESM, CanESM2, CNRM-CM5, CSIRO-Mk3-6-0, GFDL-ESM2G, GFDL-ESM2M, inmcm4, MIROC-ESM-CHEM, MIROC-ESM, MIROC5, MRI-CGCM3, HadGEM2-CC, HadGEM2-ES.
3. ^The Multivariate Adaptive Constructed Analogs (MACA) method is a statistical downscaling approach that translates the coarse resolution of daily output from global climate models into local weather data at the time and spatial scale needed for regional impact assessment. The MACA method is advantageous due to the use of constructed analogs to avoid interpolation from reanalysis and the use of multivariate approach that improves the physical relationships between weather variables (see the detailed discussion in Abatzoglou and Brown, 2012). The MACA method, as a statistical downscaling approach, requires a long-term high-quality data that include a representative sample of observations.
4. ^A variety of farm-level characteristics can be taken into account in households to simulate the economic and social consequences of climate change and adaptation, but typically key factors, including farm size, agricultural production costs and revenues, non-farm income, and household size, are used to characterize farm households.
5. ^We assume that production costs are proportional to revenues that are the product of prices and yields. When predicting the future cost-over-revenue ratio, we use projected prices and yields according to the RAPs and crop simulations. Also, the assumption of a stable cost-over-revenue ratio in the long term is plausible, given the fact that farming business is competitive. If there was a decoupling due to price shocks, the cost-over-revenue ratio would vary in the short term (e.g., a year) but eventually stabilize in the long term, which is appropriate for climate change impact assessment. Moreover, our observed county-level data shows that the cost-over-revenue ratio is stable from 1974 to 2004.
6. ^The agricultural census provides detailed information on individual farms such as farm size, observed yields, agricultural production costs and revenues, government payments, and non-farm income. However, the exact location of an individual farm is not available in the agricultural census due to confidentiality, and zip code is the finest geographical information that is available. Yields are simulated at each gridded cell with a 4-km spatial resolution.
7. ^A relative yield was used to correct biases from crop simulation models, and in combination with observed yields, calculate projected yiel with climate change (see a detailed description in Antle et al., 2017b).
8. ^For simplicity, we assume no interactions between factors or uncertainty sources, i.e., second-order coefficients. If factors interact, the sum of shares across factors is not equal to one. Our results in Table 6 show that the sum of first-order coefficients across variables is almost equal to one for each outcome. This indicates that interactions play a small role; otherwise, the sum of first-order coefficients would be much less than one.
References
Abatzoglou, J. T., and Brown, T. J. (2012). A comparison of statistical downscaling methods suited for wildfire applications. Int. J. Climatol. 32, 772–780. doi: 10.1002/joc.2312
Antle, J. M., Jones, J. W., and Rosenzweig, C. (2017a). Next Generation agricultural system models and knowledge products: synthesis and strategy. Agric. Syst. 155, 179–185. doi: 10.1016/j.agsy.2017.05.006
Antle, J. M., Mu, J., Zhang, H., Abatzoglou, J., and Stockle, C. (2017b). Methods to assess cropping system adaptations to climate change: dryland wheat systems in the Pacific Northwest United States. Agricul. Ecosyst. Environ. doi: 10.1016/j.agee.2017.03.017. [Epub ahead of print].
Antle, J. M., Stoorvogel, J. J., and Valdivia, R. O. (2014). New parsimonious simulation methods and tools to assess future food and environmental security of farm populations. Philos. Trans. R. Soc. Lond. B Biol. Sci. 369:20120280. doi: 10.1098/rstb.2012.0280
Antle, J. M., Valdivia, R. O., Boote, K. J., Janssen, S., Jones, J. W., Porter, C. H., et al. (2015). “AgMIP's transdisciplinary agricultural systems approach to regional integrated assessment of climate impacts, vulnerability, and adaptation,” in Handbook of Climate Change and Agroecosystems: The Agricultural Model Intercomparison and Improvement Project (AgMIP) Integrated Crop and Economic Assessments—Joint Publication with American Society of Agronomy, Crop Science Society of America, and Soil Science Society of America (In 2 Parts) (London).
Claessens, L., Antle, J., Stoorvogel, J., Valdivia, R., Thornton, P., and Herrero, M. (2012). A method for evaluating climate change adaptation strategies for small-scale farmers using survey, experimental and modeled data. Agric. Syst. 111, 85–95. doi: 10.1016/j.agsy.2012.05.003
Huggins, D., Pan, B., Schillinger, W., Young, F., Machado, S., and Painter, K. (2015). Crop Diversity and Intensity in Pacific Northwest Dryland Cropping Systems. REACCH Annual Report.
Nelson, G. C., Valin, H., Sands, R. D., Havlík, P., Ahammad, H., Deryng, D., et al. (2014). Climate change effects on agriculture: Economic responses to biophysical shocks. Proc. Natl. Acad. Sci. U.S.A. 111, 3274–3279. doi: 10.1073/pnas.1222465110
O'Neill, B., Kriegler, E., Riahi, K., Ebi, K., Hallegatte, S., Carter, T., et al. (2014). A new scenario framework for climate change research: the concept of shared socioeconomic pathways. Clim. Change 122, 387–400. doi: 10.1007/s10584-013-0905-2
Porter, J. R., Xie, L., Challinor, A. J., Cochrane, K., Howden, S. M., Iqbal, M., et al. (2014). “Food security and food production systems,” in Climate Change 2014: Impacts, Adaptation, and Vulnerability. Part A: Global and Sectoral Aspects. Contribution of Working Group II to the Fifth Assessment Report of the Intergovernmental Panel on Climate Change, eds C. B. Field, V. R. Barros, D. J. Dokken, K. J. Mach, M. D. Mastrandrea, T. E. Bilir, M. Chatterjee, K. L. Ebi, Y. O. Estrada, R. C. Genova, B. Girma, E. S. Kissel, A. N. Levy, S. MacCracken, P. R. Mastrandrea, and L. L. White (Cambridge, UK; New York, NY: Cambridge University Press), 485–533.
Reed, M. S. (2008). Stakeholder participation for environmental management: a literature review. Biol. Conserv. 141, 2417–2431 doi: 10.1016/j.biocon.2008.07.014
Rosenzweig, C., and Hillel, D. (2015). Handbook of Climate Change and Agroecosystems: The Agricultural Model Intercomparison and Improvement Project (AgMIP) Integrated Crop and Economic Assessments—Joint Publication with American Society of Agronomy, Crop Science Society of America, and Soil Science Society of America (In 2 Parts). London: World Scientific.
Rosenzweig, C., Jones, J. W., Hatfield, J. L., Ruane, A. C., Boote, K. J., Thorburn, P., et al. (2013). The Agricultural Model Intercomparison and Improvement Project (AgMIP): protocols and pilot studies. Agric. For. Meteorol. 170, 166–182. doi: 10.1016/j.agrformet.2012.09.011
Rupp, D. E., Abatzoglou, J. T., Hegewisch, K. C., and Mote, P. W. (2013). Evaluation of CMIP5 20th century climate simulations for the Pacific Northwest USA. J. Geophys. Res. Atmos. 118, 10884–10906. doi: 10.1002/jgrd.50843
Stöckle, C. O., Donatelli, M., and Nelson, R. (2003). CropSyst, a cropping systems simulation model. Eur. J. Agron. 18, 289–307. doi: 10.1016/S1161-0301(02)00109-0
Stöckle, C. O., Higgins, S., Nelson, R., Abatzoglou, J., Huggins, D., Pan, W., et al. (2017). Evaluating opportunities for an increased role of winter crops as adaptation to climate change in dryland cropping systems of the U.S. Inland Pacific Northwest. Clim. Change. doi: 10.1007/s10584-017-1950-z
USDA (2015). Crop Production 2014 Summary. Available online at: https://www.census.gov/history/pdf/cropan15.pdf.
USDA (2016). USDA Agricultural Projections to 2025. Available online at: http://www.usda.gov/oce/commodity/projections/USDA_Agricultural_Projections_to_2025.pdf
Valdivia, R. O., Antle, J. M., Rosenzweig, C., Ruane, A. C., Vervoot, J., Ashfaq, M., et al. (2015). “Representative agricultural pathways and scenarios for regional integrated assessment of climate change impacts, vulnerability, and adaptation,” in Handbook of Climate Change and Agroecosystems: The Agricultural Model Intercomparison and Improvement Project (AgMIP), eds C. Rosenzweig and D. Hillel (London: Imperial College Press), 101–145.
Van Vuuren, D. P., Edmonds, J., Kainuma, M., Riahi, K., Thomson, A., Hibbard, K., et al. (2011). The representative concentration pathways: an overview. Clim. Change 109, 5–31. doi: 10.1007/s10584-011-0148-z
von Lampe, M., Willenbockel, D., Ahammad, H., Blanc, E., Cai, Y., Calvin, K., et al. (2014). Why do global long term scenarios for agriculture differ? An overview of the AgMIP Global Economic Model Intercomparison. Agric. Econ. 45, 3–20. doi: 10.1111/agec.12086
Wallach, D., Mearns, L. O., Rivington, M., Antle, J. M., and Ruane, A. C. (2015). “Uncertainty in agricultural impact assessment,” in Handbook of Climate Change and Agroecosystems: The Agricultural Model Intercomparison and Improvement Project (AgMIP) Integrated Crop and Economic Assessments, Part 1, eds C. Rosenzweig and D. Hillel (London: ICP Series on Climate Change Impacts, Adaptation, and Mitigation Imperial College Press), 223–260.
Keywords: representative agricultural pathways, regional integrated assessment, climate change, wheat production, U.S. Pacific Northwest
Citation: Antle JM, Mu JE, Zhang H, Capalbo SM, Diebel PL, Eigenbrode SD, Kruger CE, Stöckle CO, Wulfhorst JD and Abatzoglou JT (2017) Design and Use of Representative Agricultural Pathways for Integrated Assessment of Climate Change in U.S. Pacific Northwest Cereal-Based Systems. Front. Ecol. Evol. 5:99. doi: 10.3389/fevo.2017.00099
Received: 22 January 2017; Accepted: 07 August 2017;
Published: 14 September 2017.
Edited by:
Urs Feller, University of Bern, SwitzerlandReviewed by:
Fernando José Cebola Lidon, Faculdade de Ciências e Tecnologia da Universidade Nova de Lisboa, PortugalCarmen De Jong, University of Strasbourg, France
David Parsons, Swedish University of Agricultural Sciences, Sweden
Copyright © 2017 Antle, Mu, Zhang, Capalbo, Diebel, Eigenbrode, Kruger, Stöckle, Wulfhorst and Abatzoglou. This is an open-access article distributed under the terms of the Creative Commons Attribution License (CC BY). The use, distribution or reproduction in other forums is permitted, provided the original author(s) or licensor are credited and that the original publication in this journal is cited, in accordance with accepted academic practice. No use, distribution or reproduction is permitted which does not comply with these terms.
*Correspondence: John M. Antle, john.antle@oregonstate.edu