
Set StockSmart Terrain Use Parameters
Tip Hudson is a regional Extension specialist in rangeland ecology & livestock production and the Director for Kittitas County Extension.
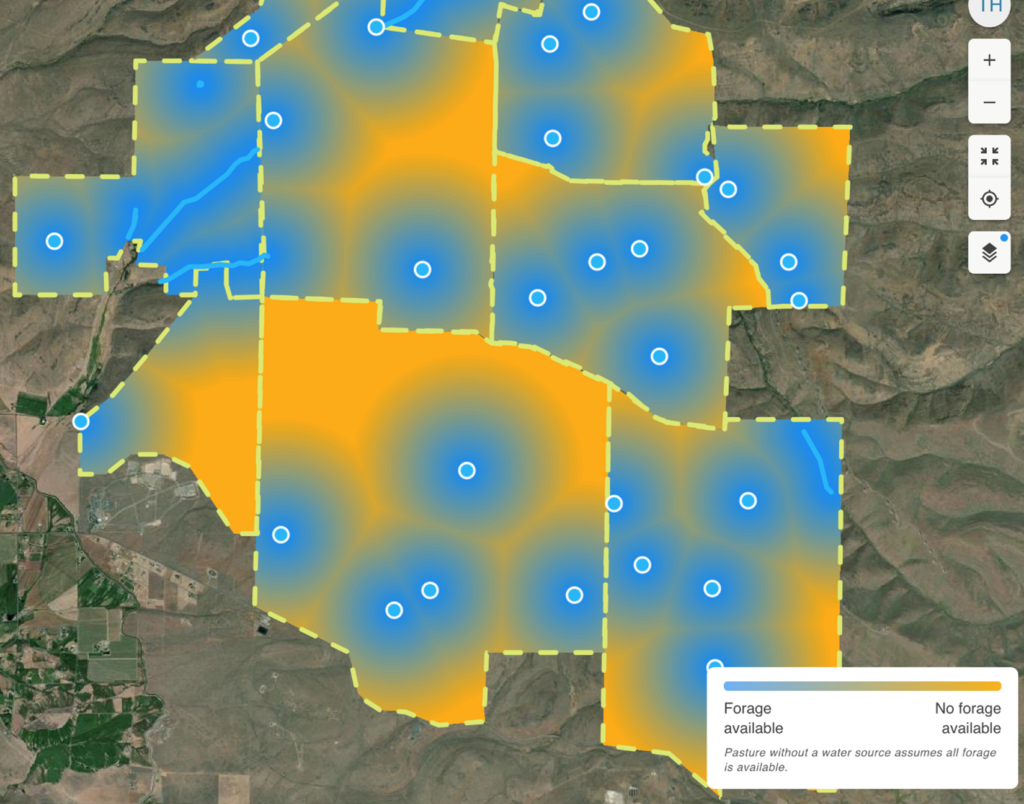
StockSmart lets rangeland managers visualize forage across the landscape, accounting for how slope and distance to water affect forage availability. When setting up a project, be sure to set the “terrain use” variables. Terrain use modeling is based on limits YOU set for your animals: how far they will travel to water and how steep a slope they will graze.
Adding a slope limit will further adjust the accessibility calculation. If you set the maximum slope at 30 degrees, a spot on a 45-degree hillside (100% slope, or 1:1 rise over run) will be calculated as 0% available. A spot halfway to that limit (15 degrees) will be 50% available. You can enter slope in degrees or percent.
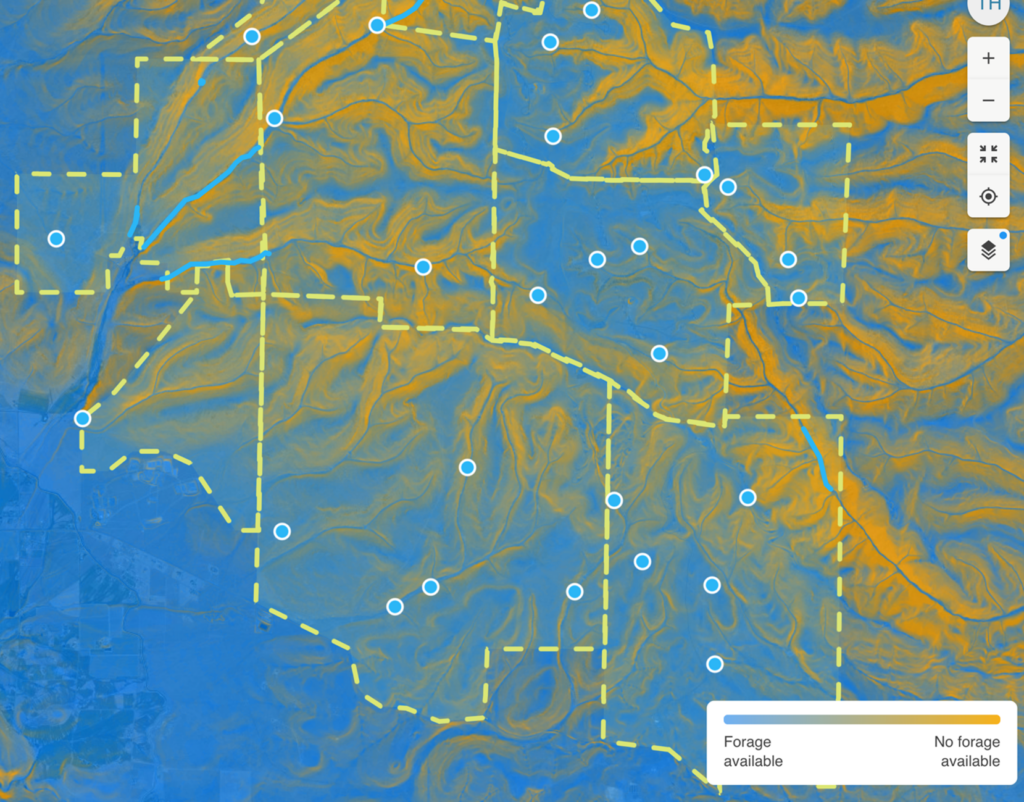
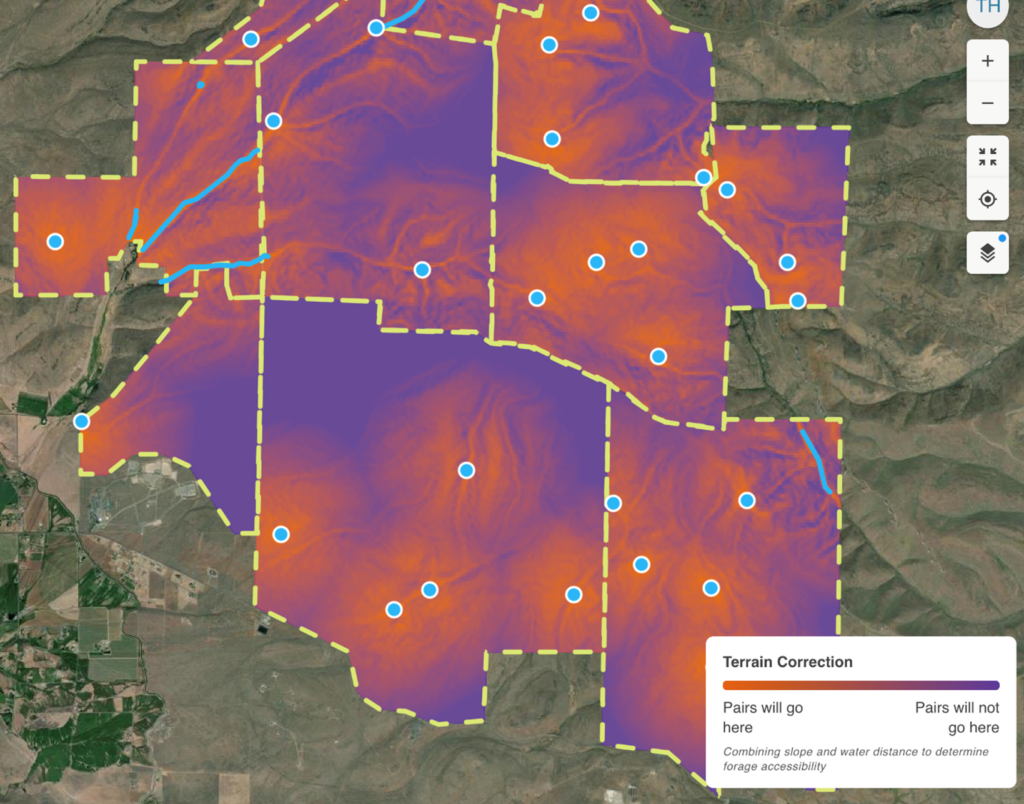
With variables set to 30% slope and maximum distance to water at 3 miles, a grazing spot with 15 degrees of slope and 1.5 miles from water will have a combined terrain use factor of 0.5 x 0.5 = 0.25. If that location grows 800 lbs/acre of grass, StockSmart will calculate 200 lbs is available.
While we use “pounds per acre” because it’s easy to visualize, StockSmart applies this same calculation to every 30-meter pixel in each pasture and the entire project. You can view this combined terrain use factor by selecting “terrain use” in the visualization options (pancake icon below the zoom buttons in the upper left of the map).
Next, select a value for the harvest coefficient. This coefficient represents how much of your total annual forage you plan to graze. In most semi-arid plant communities with short growing seasons, 25–45% is a good place to start. With more careful pasture rotations, or during plant dormancy when plants are not actively growing, higher percentages may be sustainable.
AUM values (shown as an average with high-low ranges) refer to accessible forage supply and do not depend on herd size, animal type, or animal weight. But if you select a herd size or a fixed grazing period, StockSmart will calculate how long that herd could graze an area, or how many animals could be supported for a given length of time.
For help with your project, or to learn more about using StockSmart use, results interpretation, and grazing implementation, join our monthly Meetups.